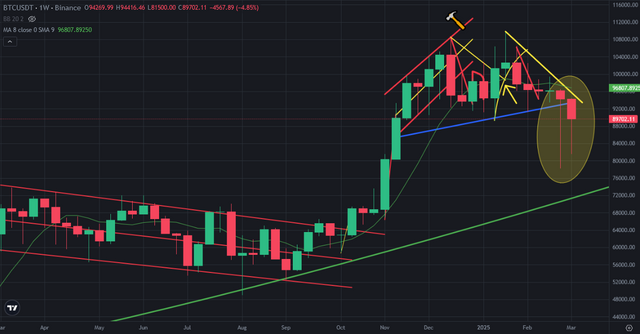
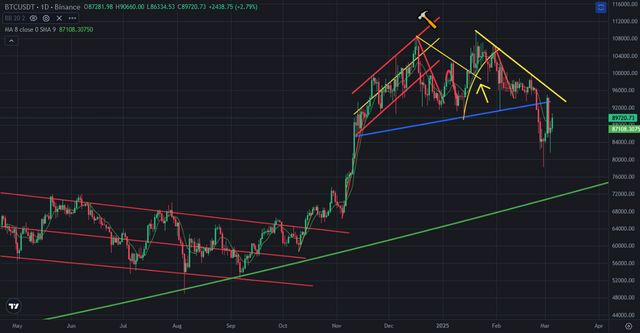
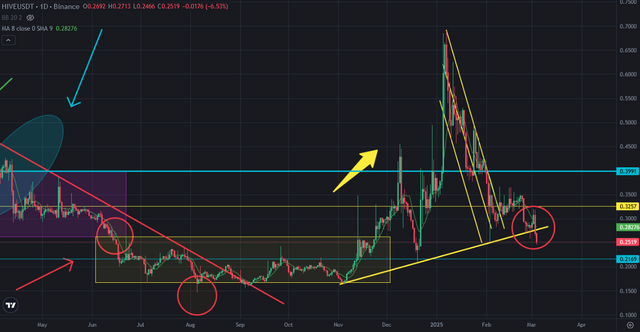
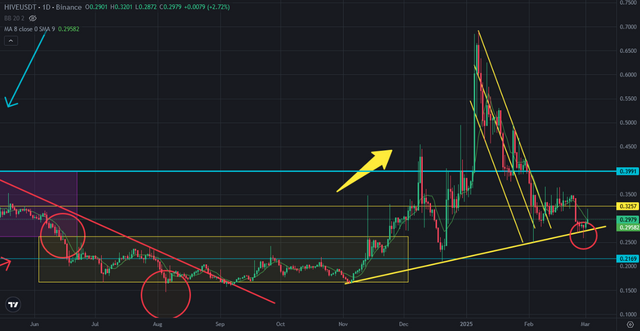
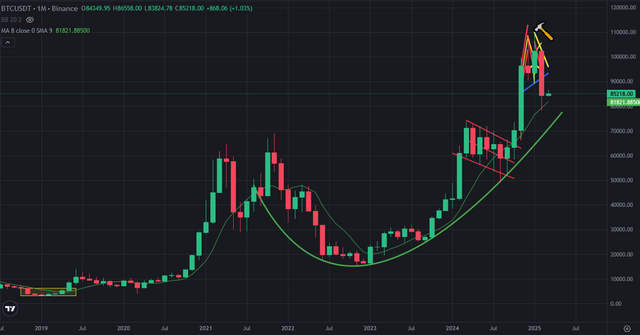
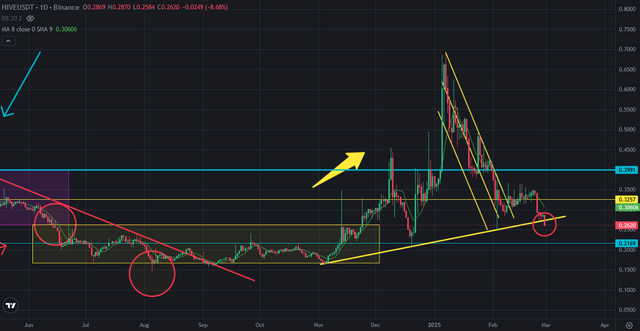
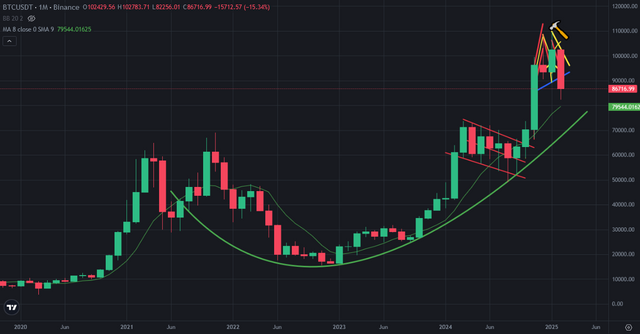
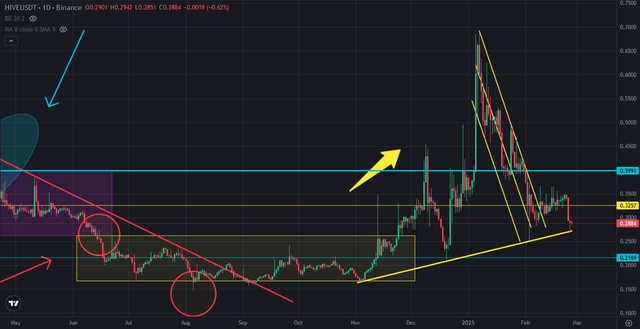
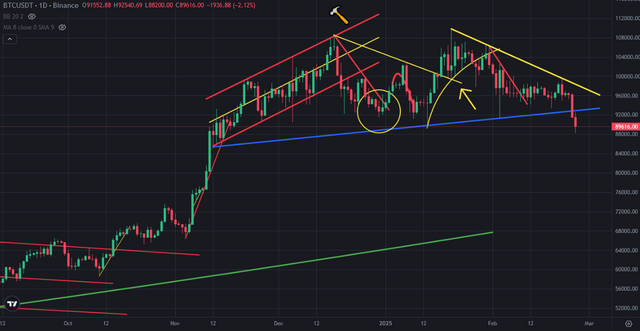
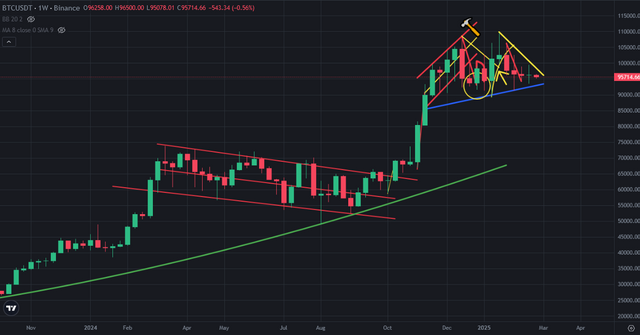
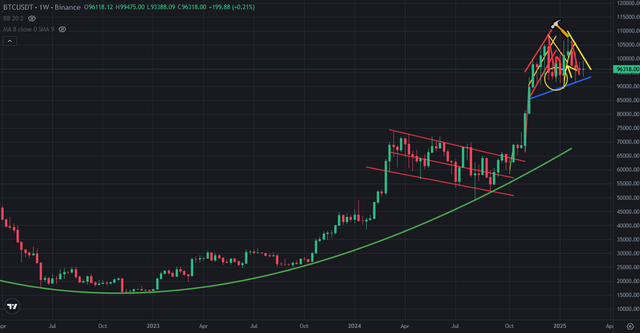
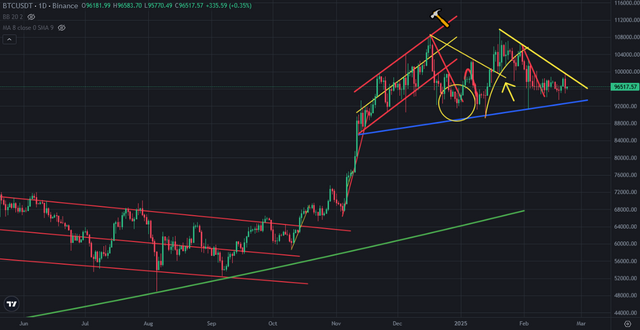
New: cryptoblurtAll contentkrblurtburnbotvideoactifitgamesphotographyartblurtgermanzzannewsblurtblocksteemr2cornellwamresearchadventurephotohealthdiscussionHotTrendingNewDAppschorock in blurt-174155 • 2 hours agoBullish Candles Seemed on Weekly Chart of BitcoinEven Bitcoin price chart got 5 weekly red candles in last 6 weeks, There are bullish weekly candles on weekly chart of Bitcoin. Even two weekly red candles on in last two weeks, weekly Bitcoin price…chorock in blurt-174155 • yesterdayBitcoin Price is Trying to Recover the Loss After ManupilationThere is huge volatility on Bitcoin price chart with manupilation of Trump. We have seen 10% green adn red daily candles on Bitcoin price chart in a few days. This situation creates a loss of…chorock in blurt-174155 • 2 days agoThere are Both Bullish and Bearish Traps on Hive Price ChartMarket maker always does fake moves. I shared an analysis about Hive price chart two days ago and I thought It was only a bearish trap on Hive price chart. There was great support line on Hive price…chorock in blurt-174155 • 4 days agoBearish Trap Seemd on Hive Price ChartWhile Bitcoin price was going down 80K USD, Hive price is tried to stay above great support line. There was great support line on daily chart of Hive price. Even Hive broke down this great support…chorock in blurt-174155 • 5 days agoBitcoin Price is on 8-Month Moving Average After one of the Worst MonthFebruary was one of the worst month for Bitcoin price chart. Bitcoin price is down more than 20% in this month. Even we saw huge monthly red candle, Bitcoin price is on 8-month moving average. It is…chorock in blurt-174155 • 6 days agoHive Price Broke Down Great Support Line After Market CrashHive price tried to not to break down great support line coming from November 2024. It was tested 4 times before and It supported Hive price as well. Today, Hive price broke down this great support…chorock in blurt-174155 • 7 days agoMonthly Chart of Bitcoin Looks HorribleWe have not seen successive red monthly candles on Bitcoin price chart since August 2023. Bitcoin got 15% monhtly candle in this month. Even we have not seen successive red monthly candles on…chorock in blurt-174155 • 8 days agoHive Price is on Great Support Line Even Market Goes DownLots of altcoins are down more than 20%. Hive price was solid while market going down. It is on great support line. Hive price tested this great support line again. It is greater than past. Hive…chorock in blurt-174155 • 9 days agoBitcoin Price Broke Down Great Support - The Worst Scenario BeganBitcoin price broke down great support line on the top and the worst scenario on crypto market started. Most of altcoins are at the bottom before Bitcoin broke down great support line. Now they are…chorock in blurt-174155 • 10 days agoBitcoin Got Green Weekly Candle to Break the red Candle SetThere were 3 red weekly successive candles on Bitcoin price chart. Bitcoin price closed last week with green candle to break the red candle set. We have now seen 5 red weekly candle series since…chorock in blurt-174155 • 11 days agoBitcoin Price Chart May Get 4th Weekly Red CandleThis is the last day of the week. Bitcoin price chart may get 4th weekly red candle. If it gets, next week may be green for Bitcoin price chart. Here you can see weekly chart of Bitcoin price.…chorock in blurt-174155 • 12 days agoBitcoin Price Resisted by Downtrend LineYesterday Bitcoin price was going up. It was close to breaking up downtrend line coming from 108K. A bad news dropped on market and Bitcoin price reserved down after touching downtrend line. I…chorock in blurt-174155 • 13 days ago100K USD is Great Resistance for Bitcoin Price ChartThere is major resistance on Bitcoin price chart. I shared a few analysis about Bitcoin price chart and said, the middle line of Bollinger Bands is one of great resistance for Bitcoin price chart.…chorock in blurt-174155 • 14 days agoBitcoin Price is Getting Ready to Break up The Middle Line of Bollinger BandsBitcoin price touched the middle line of Bollinger Bands in daily chart. It is one of major resistance on Bitcoin price chart. This is 2nd touch on the middle line of Bollinger Bands. We may see…chorock in blurt-174155 • 15 days agoBitcoin Price is Staying on Great Support Line Even Market CrashesThere is small market crash on crypto with Ethereum dump. Even crypto market is down, Bitcoin price is still at safe level. It is on great support line. There is no danger when Bitcoin price is on…chorock in blurt-174155 • 16 days agoHive Price is Resisted by the Middle Line of Bollinger BandsHive price is in price correction for a month. Crypto market is down more than %50 in this time. Hive price is close to complete price correction. Hive price resisted by the middle line of Bollinger…chorock in blurt-174155 • 17 days agoBitcoin Price Chart Got 3 Successive Red Weekly CandlesThis is 4th week after Bitcoin price got 3 successive red weekly candles. We have seen 4 successive red weekly candles series on Bitcoin price chart this year. It may be the last red week on Bitcoin…chorock in blurt-174155 • 18 days agoBitcoin Price Met With the Middle Line of Bollinger Bands on Daily ChartBitcoin price touched one of resistance. The middle line of Bollinger Bands on daily chart is one of the resistance for Bitcoin price. Here you can see daily char tof Bitcoin. You can see how it…chorock in blurt-174155 • 19 days agoGreat Bowl Pattern is on SPS Price ChartSPS price is close to the bottom. Ecen lots of altcoins are at all time low level, SPS is trying to built the bottom. There seemed a great bowl pattern on SPS price chart. There you can see weekly…chorock in blurt-174155 • 20 days agoHive Price Supported by the Middle Line of Bollinger BandsHive price is on great support line. It is on the middle line of Bollinger Bands. Here you can see the weekly chart of Hive price. The Middle line of Bollinger Bands supported Hive price. After…