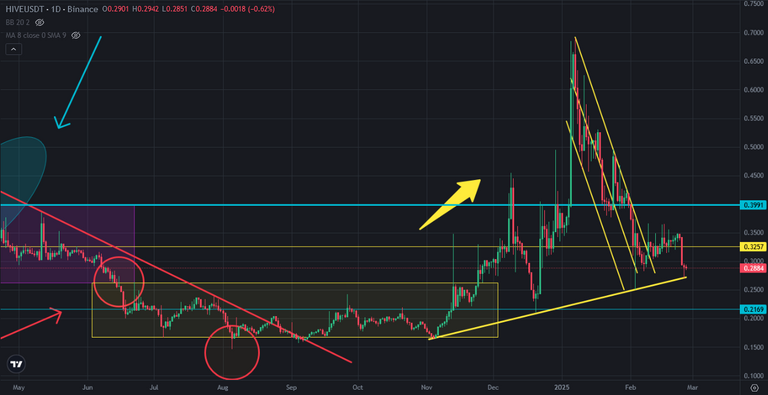
Lots of altcoins are down more than 20%. Hive price was solid while market going down. It is on great support line. Hive price tested this great support line again. It is greater than past. Hive price is still in bullish trend by supporting great suport line.
Here you can see daily chart of Hive price. I shared this draft a few years ago. It worked as well. Hive price is still above depression zone. There is no doubt that Hive price is in bullish trend. This is 4th touch of this support line. So, we may not see these level again in Hive price chart for a few months. Hive price is ready to go up..
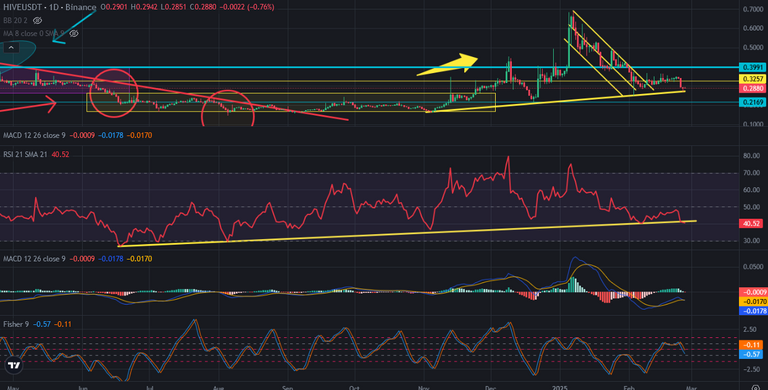
Here you can see the indicators on daily chart of Hive price. There is support line on RSI Indicator. Hive is still on this support line of RSI Indicator. So, we may see price pump on Hive price chart in a few days.
Fihser and MACD Indicators are close to the bottom. They may reverse up in few days. When they reverse, we may see price pumps on Hive price chart. There is no doubt that Hive price will be the star of 2025 as the beginning of the year..
It was great chance to pick up Hive price from 0,27 USD level. When we look at Hive price chart, we can see the bottom of crypto market. Crypto market may reverse up from this level.i
We will see..