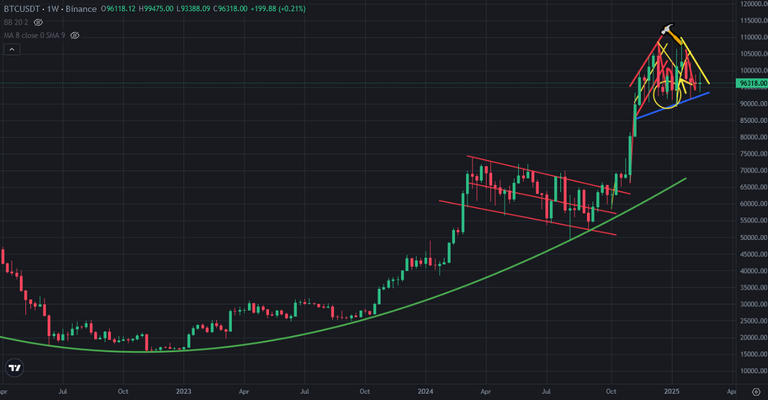
This is the last day of the week. Bitcoin price chart may get 4th weekly red candle. If it gets, next week may be green for Bitcoin price chart.
Here you can see weekly chart of Bitcoin price. There is no 5 successive weekly red candles since Luna crash. This is 3rd year we hane not seen 5 successive weekly red candles on Bitcoin price chart. If it happens, we may see breaking down the great support line on Bitcoin price chart..
There is also great downtrend line on Bitcoin price chart. If we see greaan weekly candle on Bitcoin price chart, this downtrend line will be broken up! This is why next week is so important..
Here you can see the indicators on weekly chart of Bitcoin. They seems bearish. There is great negative divergence on RSI Indicator. The top of RSI Indicator is getting lower. We should see price dump on weekly chart of Bitcoin. We have not seen after seeing this negative divergence.
MACD Indicator reversed down from the top. This is why Bitcoin price can not go up. I should complete correction. It may take a few months to complete correction on MACD Indicator.
Even Fisher Indicator is at good level to reverse up. MACD and RSI Indicator looks bearish. This is why Bitcoin price can not go up.
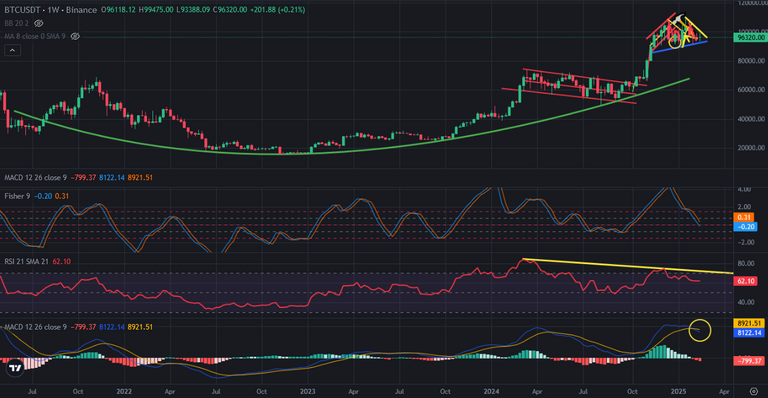
So, we may see price correction on Bitcoin price chart for a few weeks. We need only time to complete price correction.
We will see..