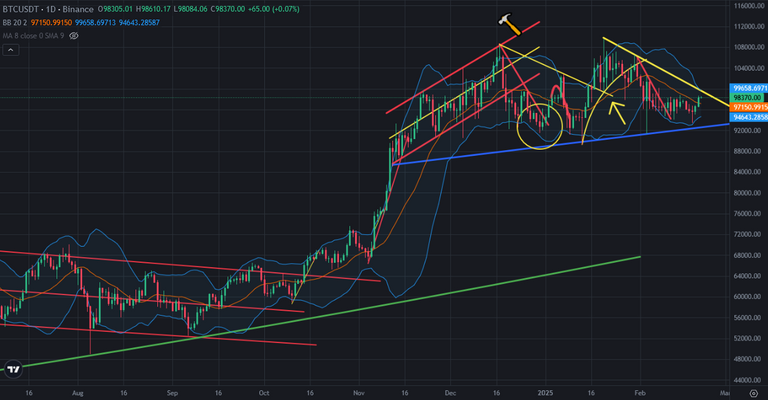
There is major resistance on Bitcoin price chart. I shared a few analysis about Bitcoin price chart and said, the middle line of Bollinger Bands is one of great resistance for Bitcoin price chart. Bitcoin broke up this resistance. The next major resistance is at 100K USD.
Here you can see daily chart of Bitcoin. Even Bitcoin price broke up the middle line of Bollinger Bands, the top line of Bollinger Bands may resist Bitcoin price in daily chart. It is at 100K USD level. There is also downtrend line on Bitcoin price chart. 100K USD is the level of downtrend line.
Here you can see the indicators on daily chart of Bitcoin. RSI Indicator is close to touch downtrend line. This is one of major resistance on Bitcoin price chart. It may be hard to break up these major resistances.
Even MACD and Fisher Indicators reversed from the bottom, They will go up to the top in a few days. We may see reverse down in these indicators in a few days If Bitcoin price resists by 100K USD resistances.
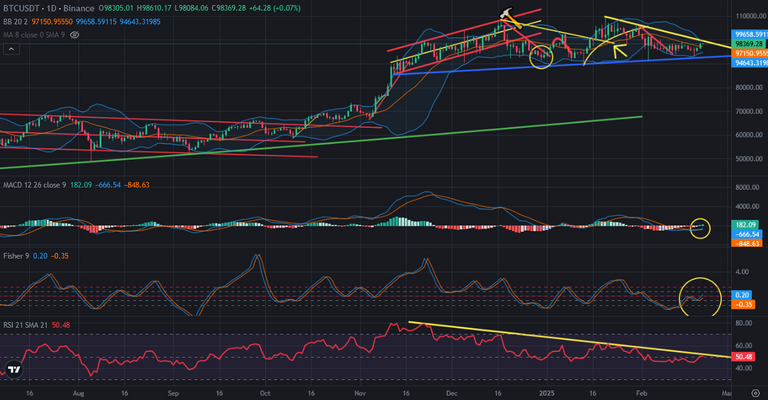
So, it may be early to break up these major resistance for Bitcoin price chart. We may see the power of resistance in a few days at 100K USD level.
We will see..