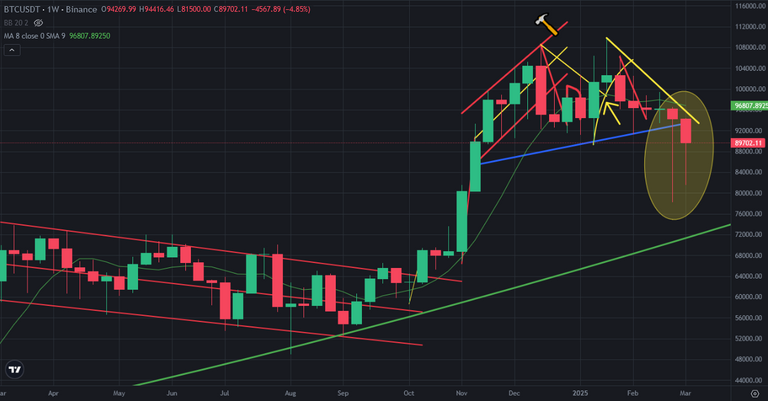
Even Bitcoin price chart got 5 weekly red candles in last 6 weeks, There are bullish weekly candles on weekly chart of Bitcoin. Even two weekly red candles on in last two weeks, weekly Bitcoin price chart started to seem as bullish.
Here you can see weekly chart of Bitcoin. There are two bullish doji candles on Bitcoin price chart. It is one of great signal of reversing. There was great bearish doji candle at 108K USD, you can see what happened after this doji candle.
Even Bitcoin price broke down great support line, It is good to see bullish doji candles..
Here you can see the indicators on weekly chart of Bitcoin. Fisher Indicators is close to the bottom. It may reverse in a few weeks. This is only one bullish indicator when we look at the indicators on weekly chart of Bitcoin.
MACD Indicator is on the top needs time to complete correction. There is negative divergence on RSI Indicator. These are bearish indicators on weekly chart of Bitcoin.
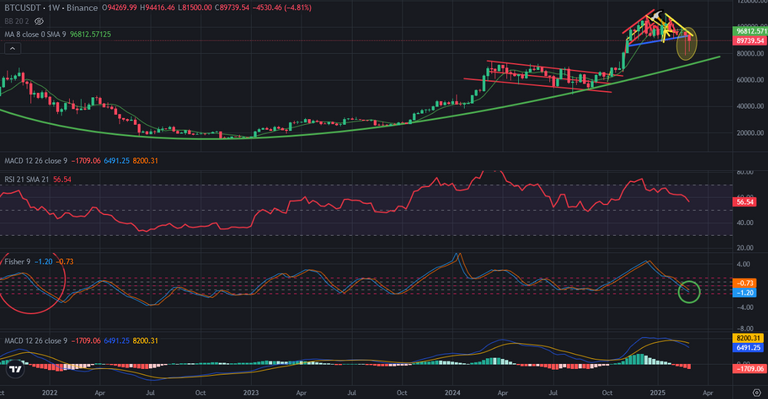
Even indicators seems mostly bearish, it is good to see bullish things on weekly chart of Bitcoin.
Bitcoin price started to seem bullish. We need time.
We will see..