There is huge volatility on Bitcoin price chart with manupilation of Trump. We have seen 10% green adn red daily candles on Bitcoin price chart in a few days. This situation creates a loss of confidence in investors. This situation causes altcoins to melt. There are bearish resistances in front of the Bitcoin price chart. With these indecisive movements, Bitcoin is delayed in breaking these resistances.
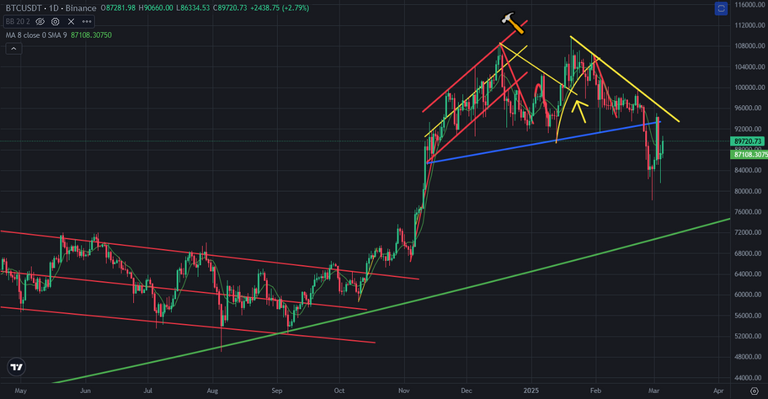
Here you can see daily chart of Bitcoin. There is great downtrend line coming from 108K. There was a support line on Bitcoin price chart It is broken down and It works was a resistance. With manupilation of Trump, Bitcoin price went up fast with 10% daily green candle. It could not break up this resistance. We need to see another try to break up this resistance..
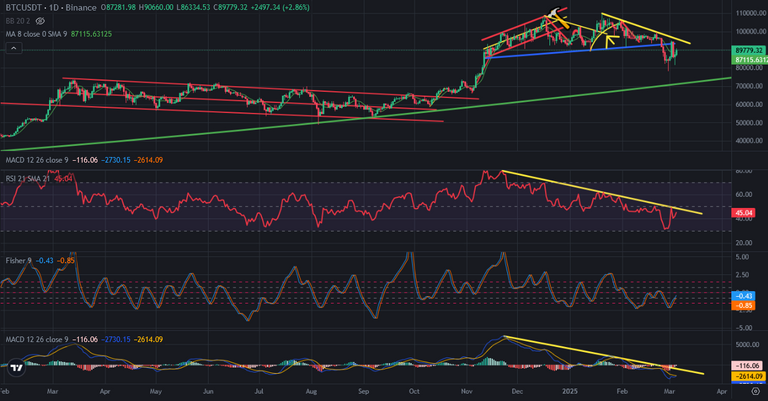
Here you can see the indicators on daily chart of Bitcoin. There are downtrend lines on the indicators. Bitcoin is trying to break up this downtrend lines on the indicators. If we see 2-3 daily green candles on Bitcoin price chart in this week, Bitcoin may break up great resistances on the indicators..
MACD and Fisher Indicators are ready to break up downtrend lines. They are major indicators. It may be great to see break up downtrend lines on these indicators.
We need to see more daily green candles. We want to see a decrease in volatility and a stable increase.
We will see..