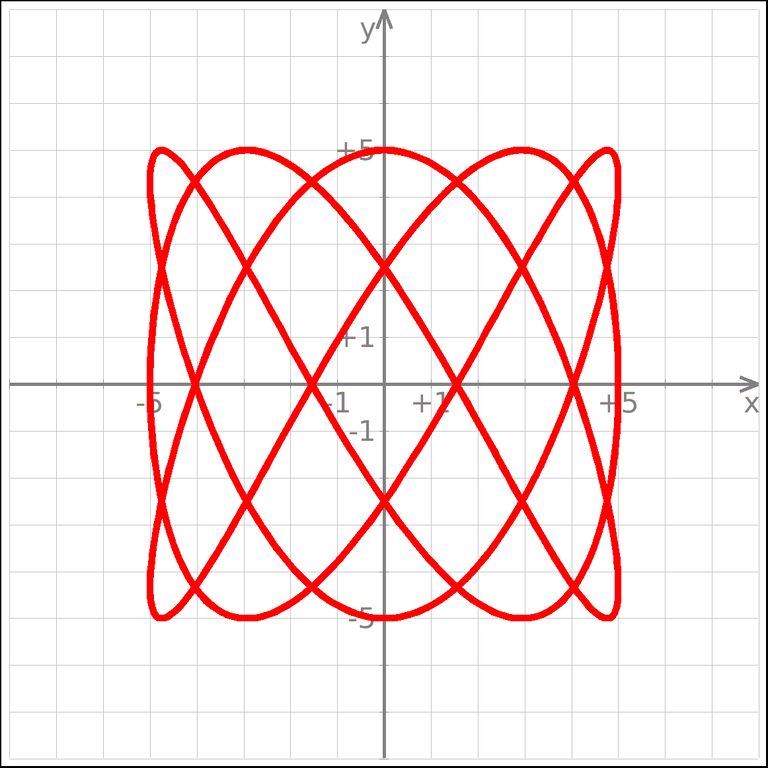
Ultimo post de esta guia dedicada a este excelente ploteador de distribución libre y gratuita.
KmPlot está integrado en un poderoso analizador, y te permite plotear diferentes funciones simultáneamente y combinar los resultados para construir nuevas funciones.
• Kmplot soporta también funciones con parámetros.
• Los plots pueden ser imprimidos con alta precisión y con la escala correcta.
• KmPlot soporta varios tipos de gráficos diferentes:
• Gráficas cartesianas explícitas de la forma y = f(x).
• Gráficas paramétricas, donde los componentes x e y se especifican como funciones de una variable independiente.
• Gráficas polares de la forma r = r(θ).
• Gráficas implícitas, donde las coordenadas x e y se relacionan a través de una expresión.
• Gráficos diferenciales explícitos.
• KmPlot también proporciona algunas características numéricas y visuales como:
• Rellenado y cálculo del área entre el gráfico y el primer eje
• Encontrar los valores máximo y mínimo
• Cambiar parámetros de la función dinámicamente
• Dibujar funciones derivadas e integrales.
Estas características ayudan a aprender las relaciones entre las funciones matemáticas y su representación gráfica en un sistema de coordenadas.
Configuración del Sistema de coordenadas.

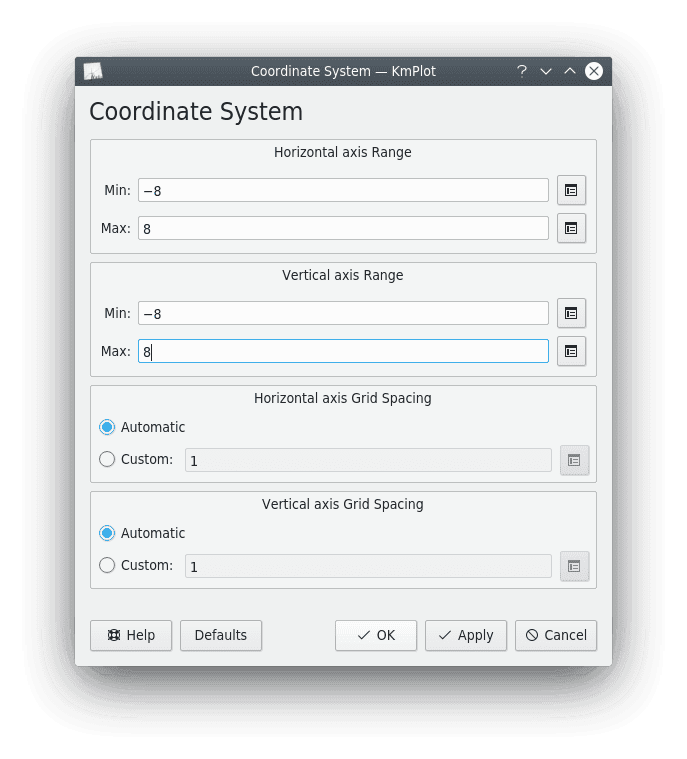
Para abrir este diálogo seleccione Ver → Sistema de coordenadas... en la barra del menú.
Captura de pantalla del diálogo del sistema de coordenadasConfiguración de los Ejes.
Intervalo del eje X.
Fija el intervalo para la escala del eje X. Tenga en cuenta que puede usar las funciones y constantes predefinidas (vea “Nombre predefinidos de funciones y constantes” como los extremos del intervalo (p. ej., asigne a Mín: el valor 2*pi).
También puede usar las funciones que haya definido para fijar los extremos del intervalo del eje. Por ejemplo, si ha definido una función f(x) = x^2, puede asignar a Mín: el valor f(3), que hará que el extremo inferior del intervalo sea igual a 9.
Intervalo del eje Y
Fija el intervalo para el eje Y. Vea «Intervalo del eje X» más arriba
Espaciado de rejilla en el eje X.
Esto controla el espacio entre las líneas de la rejilla en la dirección horizontal. Si selecciona Automático, KmPlot tratará de encontrar un espaciado de líneas de la rejilla de cerca de dos centímetros, que también es numéricamente agradable.
Si selecciona Personalizado podrá introducir el espacio horizontal de la rejilla. Este valor se usará sin tener en cuenta la ampliación. Por ejemplo, si introduce un valor de 0,5 y el intervalo del eje X va de 0 a 8, se mostrarán 16 líneas en la rejilla.
Espaciado de rejilla en el eje Y.
Esto controla el espaciado entre las líneas de la rejilla en la dirección vertical. Vea «Espaciado de la rejilla en el eje X» más arriba.
Configuración de las Constantes.
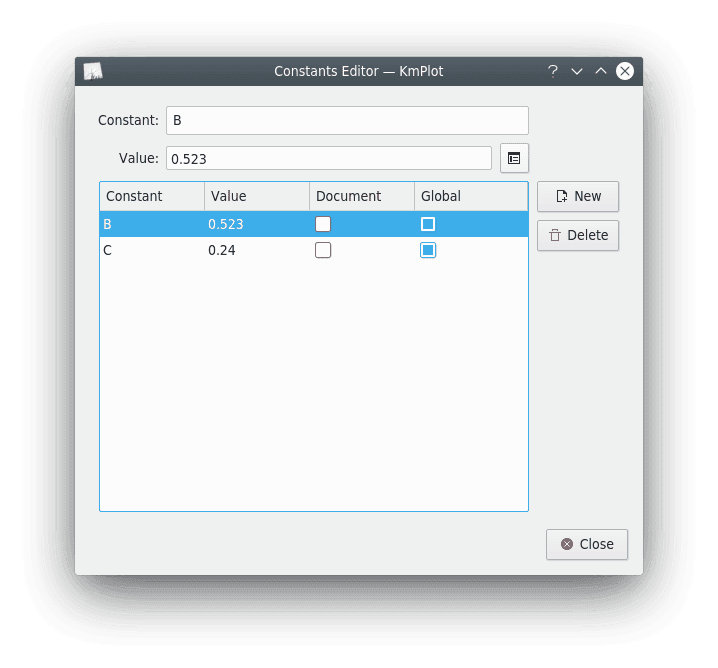
Para abrir este diálogo seleccione Editar → Constantes... en la barra de menú.
Captura de pantalla del diálogo de constantes
Las constantes se pueden usar como parte de una expresión en cualquier lugar de KmPlot. Cada constante debe tener un nombre y un valor. Algunos nombres no son válidos, como por ejemplo los nombres de funciones y constantes ya existentes.
Existen dos opciones que controlan el alcance de una constante:
Documento.
Si selecciona la casilla Documento, la constante se guardará junto al diagrama actual cuando lo guarde en un archivo. No obstante, a menos que también haya seleccionado la opción Global, la constante no estará disponible entre varias instancias de KmPlot.
Global.
Si selecciona la casilla Global, el nombre y el valor de la constante se guardará en las preferencias de KDE (donde también podrá ser usado por KCalc). La constante no se perderá cuando cierre KmPlot, y estará disponible para ser usada de nuevo cuando vuelva a iniciar KmPlot.
SEPARADOR
Last post of this guide dedicated to this excellent plotter of free and free distribution.
KmPlot is integrated in a powerful parser, and allows you to plot different functions simultaneously and combine the results to build new functions.
- Kmplot also supports functions with parameters.
- Plots can be printed with high precision and with the correct scale.
- KmPlot supports several different types of plots:
- Explicit Cartesian plots of the form y = f(x).
- Parametric plots, where the x and y components are specified as functions of an independent variable.
- Polar plots of the form r = r(θ).
- Implicit graphs, where the x and y coordinates are related through an expression.
- Explicit differential plots.
- KmPlot also provides some numerical and visual features such as:
- Filling and calculation of the area between the plot and the first axis.
- Finding the maximum and minimum values
- Changing function parameters dynamically
- Drawing derivative and integral functions.
These features help to learn the relationships between mathematical functions and their graphical representation in a coordinate system.
Coordinate System Settings.
To open this dialog select View → Coordinate System... from the menu bar.
Screenshot of the coordinate system dialogSetting up the Axes.
X-axis range.
Sets the interval for the X-axis scale. Note that you can use predefined functions and constants (see "Predefined name of functions and constants" as the ends of the interval (e.g., assign Min: the value 2*pi).
You can also use the functions you have defined to set the ends of the axis interval. For example, if you have defined a function f(x) = x^2, you can assign Min: the value f(3), which will make the lower end of the interval equal to 9.
Y-axis interval
Sets the interval for the Y-axis. See "X-axis interval" above.
Grid spacing on the X-axis.
This controls the spacing between grid lines in the horizontal direction. If you select Automatic, KmPlot will try to find a grid line spacing of about two centimeters, which is also numerically pleasing.
If you select Custom you can enter the horizontal grid spacing. This value will be used regardless of the magnification. For example, if you enter a value of 0.5 and the X-axis interval goes from 0 to 8, 16 lines will be displayed in the grid.
Y-axis grid spacing.
This controls the spacing between grid lines in the vertical direction. See "X-axis grid spacing" above.
Constants Settings.

To open this dialog select Edit → Constants... in the menu bar.
Screenshot of the constants dialog
Constants can be used as part of an expression anywhere in KmPlot. Each constant must have a name and a value. Some names are not valid, such as the names of existing functions and constants.
There are two options that control the scope of a constant:
Document.
If you select the Document check box, the constant will be saved next to the current diagram when you save it to a file. However, unless you have also selected the Global option, the constant will not be available across multiple instances of KmPlot.
Global.
If you select the Global checkbox, the name and value of the constant will be saved in the KDE preferences (where it can also be used by KCalc). The constant will not be lost when you close KmPlot, and will be available for use again when you restart KmPlot.
Home Page oficial del proyecto: /Official home page of the project: KmPlot.
Screenshots / Capturas de pantallas:
| Blogs, Sitios Web y Redes Sociales / Blogs, Webs & Social Networks | Plataformas de Contenidos/ Contents Platforms |
|---|---|
| Mi Blog / My Blog | Los Apuntes de Tux |
| Red Social Twitter / Twitter Social Network | @hugorep |


- Guía de KmPlot excelente programa libre de representación de funciones: sintaxis y extensiones. [ESP-ENG]
- Guía de KmPlot excelente programa libre de representación de funciones: como configurarlo. [ESP-ENG]
- Guía de KmPlot excelente programa libre de representación de funciones: cómo combinar y cambiar la apariencia de las funciones. [ESP-ENG]
- Guía de KmPlot excelente programa libre de representación de funciones: tipos de funciones. [ESP-ENG]
- Guia de KmPlot excelente programa libre de representación de funciones: dibujar una función simple y editar propiedades. [ESP-ENG]
Posted from https://blurtlatam.intinte.org
Hi @hugo1954, great news! Your content was selected by curators @oneray, @ten-years-before to receive a special curation from BeBlurt 🎉 Don't hesitate to upvote this comment as the curators will receive 80% of the rewards for their involvement.
You can support us by voting for our witness, our decentralized funding proposal, or through delegation. You're also welcome to join our Discord server 👉 https://discord.beblurt.com
Thanks to all the curation team at @beblurt for supporting my content.