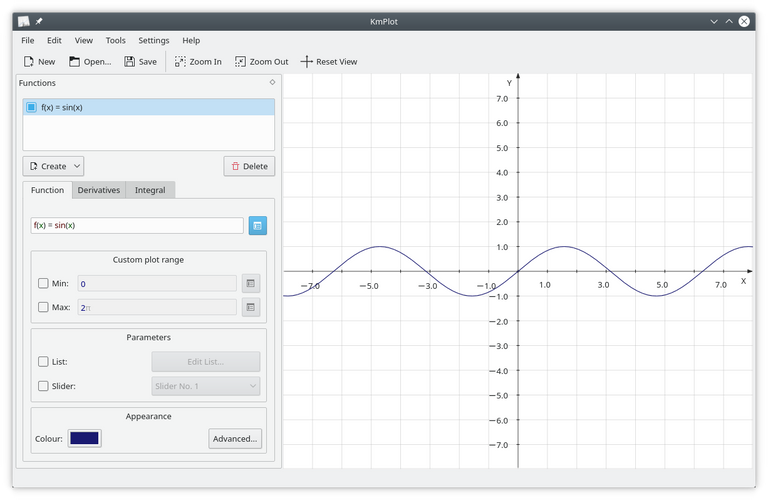
KmPlot es un trazador de funciones matemáticas para el escritorio KDE. Incluye un potente procesador. Puede trazar diferentes funciones de forma simultánea y combinar sus elementos para construir nuevas funciones.
Tipos de gráficos soportados.
KmPlot soporta varios tipos de gráficos diferentes:
Gráficas cartesianas explícitas de la forma y = f(x).
Gráficas paramétricas, donde los componentes x e y se especifican como funciones de una variable independiente.
Gráficas polares de la forma r = r(θ).
Gráficas implícitas, donde las coordenadas x e y se relacionan a través de una expresión.
Gráficos diferenciales explícitos.
KmPlot también proporciona algunas características numéricas y visuales como:
Rellenado y cálculo del área entre el gráfico y el primer eje
Encontrar los valores máximo y mínimo
Cambiar parámetros de la función dinámicamente
Dibujar funciones derivadas e integrales.
Estas características ayudan a aprender las relaciones entre las funciones matemáticas y su representación gráfica en un sistema de coordenadas.
Dibujar una función simple.
En la barra lateral izquierda, existe un botón Crear con un menú desplegable para crear gráficos nuevos. Púlselo y seleccione Gráfico cartesiano. Se enfocará el cuadro para editar el texto. Reemplace el texto predeterminado con:
y = x^2
y pulse Intro. Se dibujará el gráfico y = x 2 en el sistema de coordenadas.
Pulsando de nuevo el botón Crear, seleccione Gráfico cartesiano, pero esta vez escriba:
y = 5sin(x)
para crear otro gráfico.
Pulse en una de las líneas que se acaban de dibujar. La cruz tomará el color de la gráfica y se asociará a ésta. Puede utilizar el ratón para desplazar la cruz a lo largo de la gráfica. En la barra de estado de la parte superior de la ventana de coordenadas se mostrará la posición actual. Tenga en cuenta que si la gráfica toca el eje x la raíz también se mostrará en la barra de estado.
Pulse nuevamente y la cruz se separará del gráfico.
Editar propiedades.
Modifiquemos la función, y cambiemos el color de la linea trazada.
El editor de funciones lista todas las funciones que haya dibujado. Si ya no está seleccionado y = x^2, selecciónelo. Aquí tendrá acceso a muchas opciones. Vamos a renombrar la función y desplazarla 5 unidades hacia abajo. Cambie la ecuación de la función a
parabola(x) = x^2 - 5
y pulse Intro. Para seleccionar otro color para el gráfico, pulse el botón Aspecto en la parte inferior del editor de funciones y seleccione un color nuevo.
Nota:

Todos los cambios se pueden deshacer a través de Editar → Deshacer.

KmPlot is a mathematical function plotter for the KDE desktop. It includes a powerful processor. It can plot different functions simultaneously and combine their elements to build new functions.
Supported plot types.
KmPlot supports several different types of plots:
Explicit Cartesian plots of the form y = f(x).
Parametric plots, where the x and y components are specified as functions of an independent variable.
Polar plots of the form r = r(θ).
Implicit graphs, where the x and y coordinates are related through an expression.
Explicit differential plots.
KmPlot also provides some numerical and visual features such as:
Filling and calculation of the area between the plot and the first axis.
Finding the maximum and minimum values
Changing function parameters dynamically
Drawing derivative and integral functions.
These features help to learn the relationships between mathematical functions and their graphical representation in a coordinate system.
Drawing a simple function.
In the left sidebar, there is a Create button with a drop-down menu for creating new graphs. Click it and select Cartesian graph. The box for editing the text will come into focus. Replace the default text with:
y = x^2
and press Enter. The graph y = x 2 will be drawn in the coordinate system.
Pressing the Create button again, select Cartesian Graph, but this time type:
y = 5sin(x)
to create another graph.
Click on one of the lines just drawn. The cross will take the color of the graph and will be associated with it. You can use the mouse to move the cross along the graph. The current position will be displayed in the status bar at the top of the coordinate window. Note that if the graph touches the x-axis the root will also be displayed in the status bar.
Press again and the crosshairs will be detached from the graph.
Edit properties.
Let's modify the function, and change the color of the plotted line.
The function editor lists all the functions you have drawn. If y = x^2 is not already selected, select it. Here you have access to many options. Let's rename the function and move it 5 units down. Change the equation of the function to
parabola(x) = x^2 - 5
and press Enter. To select another color for the graph, press the Aspect button at the bottom of the function editor and select a new color.
Note:

All changes can be undone through Edit → Undo.

Home Page oficial del proyecto: /Official home page of the project: KmPlot.
Screenshots / Capturas de pantallas:
| Blogs, Sitios Web y Redes Sociales / Blogs, Webs & Social Networks | Plataformas de Contenidos/ Contents Platforms |
|---|---|
| Mi Blog / My Blog | Los Apuntes de Tux |
| Red Social Twitter / Twitter Social Network | @hugorep |

Dear @hugo1954, your content was selected manually by curators @nalexadre, @ten-years-before to receive a curation from BeBlurt 🎉
Thank you for curating and supporting my content @beblurt. Greetings to @nalexadre and good luck in the project you are carrying out.