Todo lo que necesitas saber para comenzar a usar Linux y sus aplicaciones, uno de los ejemplos más prominentes de software libre. Guías, tutoriales y noticias de interés acerca de Linux, el sistema operativo más robusto que existe.
Hoy con la penúltima publicación de esta pequeña guia dedicada a KmPlot.
En este caso nos dedicaremos a la sintaxis y extensiones.
Algunas reglas de sintaxis deben seguir la siguiente estructura:
nombre(var1[, var2])=term [;extensiones]
nombre
El nombre de la función. Si el primer carácter es «r», el analizador asume que está usando coordenadas polares.
Si el primer carácter es «x» (por ejemplo «xfunc»), el analizador espera una segunda función que comience por «y» (por tanto, «yfunc») para definir la función de forma paramétrica.
var1
La variable de la función.
var2
La función «parámetro de grupo». Debe estar separada de las variables de la función por una coma. Puede usar el parámetro de grupo para, por ejemplo, representar varios gráficos desde una función. El valor de los parámetros puede ser seleccionado manualmente, o puede elegir utilizar una barra deslizante para controlar un parámetro determinado. Al modificar el valor del la barra deslizante, el valor del parámetro cambiará en consecuencia. Dicha barra puede tomar valores enteros del 0 al 100.
term
La expresión que define la función.
Nombre predefinidos de funciones y constantes.
Todas las funciones y constantes predefinidas que conoce KmPlot se muestran seleccionando Ayuda → Funciones matemáticas predefinidas, que muestra esta página del manual de KmPlot.
Estas funciones y constantes, y casi todas las definidas por el usuario se pueden usar para determinar también las preferencias de los ejes. Vea “Configuración de los Ejes”.
Funciones trigonométricas.
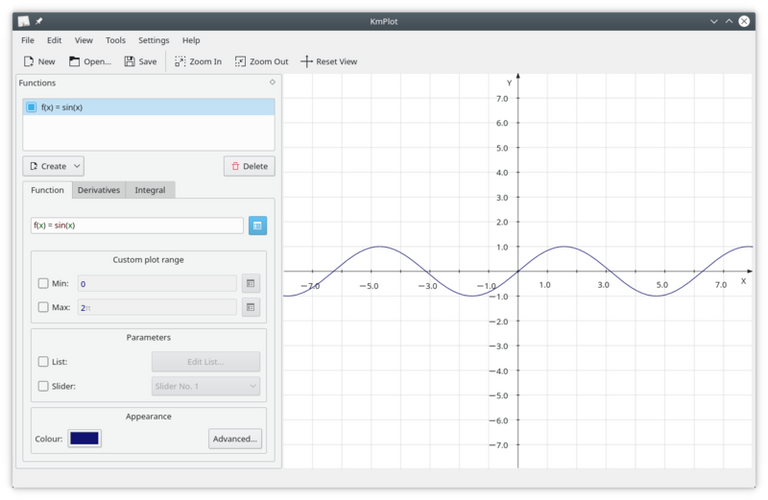
De forma predeterminada las funciones trigonométricas trabajan en radianes. Sin embargo, puede cambiar esto a través de Preferencias → Configurar KmPlot.
sin(x), arcsin(x), cosec(x), arccosec(x)
Devuelven el seno, arcoseno, cosecante y arcosecante respectivamente.
cos(x), arccos(x), sec(x), arcsec(x)
Devuelven, respectivamente, el coseno, el arcocoseno, la secante y el arcosecante.
tan(x), arctan(x), cot(x), arccot(x)
Devuelven, respectivamente, la tangente, el arcotangente, la cotangente y el arcocotangente.
Funciones hiperbólicas.
Las funciones hiperbólicas.
sinh(x), arcsinh(x), cosech(x), arccosech(x)
Devuelven, respectivamente, el seno hiperbólico, el arcoseno, la cosecante y el arcocosecante.
cosh(x), arccosh(x), sech(x), arcsech(x)
Devuelven, respectivamente, el coseno hiperbólico, el arcocoseno, la secante y el arcosecante.
tanh(x), arctanh(x), coth(x), arccoth(x)
Devuelven, respectivamente, la tangente hiperbólica, el arcotangente, la cotangente y el arcocotangente.
Otras funciones.
sqr(x)
El cuadrado x^2 de x.
sqrt(x)
La raíz cuadrada de x.
sign(x)
El signo de x. Devuelve 1 si x es positivo, 0 si es cero, o −1 si x es negativo.
H(x)
La función escalón unitario. Devuelve 1 si x es positivo, 0,5 si x es cero, o 0 si x es negativo.
exp(x)
El exponente e^x de x.
ln(x)
El algoritmo natural (exponente inverso) de x.
log(x)
El logaritmo en base 10 de x.
abs(x)
El valor absoluto de x.
floor(x)
Redondea x al entero más cercano inferior o igual a x.
ceil(x)
Redondea x al entero más cercano superior o igual a x.
round(x)
Redondea x al entero más cercano.
gamma(x)
La función gamma.
factorial(x)
El factorial de x.
min(x1,x2,...,xn)
Devuelve el mínimo de un conjunto de números {x1,x2,...,xn}.
max(x1,x2,...,xn)
Devuelve el máximo de un conjunto de números {x1,x2,...,xn}.
mod(x1,x2,...,xn)
Devuelve el módulo (longitud euclidiana) de un conjunto de números {x1,x2,...,xn}.
Constantes predefinidas.
pi, π
Constantes que representan π (3.14159...).
e
Constante que representa el número de Euler e (2.71828...).
Extensiones.
Una extensión para una función se especifica introduciendo un punto y coma seguido de la extensión, después de la definición de la función. La extensión puede escribirse utilizando el método D-Bus parser addFunction. Ninguna de las extensiones estarán disponibles para las funciones paramétricas, pero N y D[a,b] funcionan también para las funciones polares. Por ejemplo:
f(x)=x^2; A1
mostrará el gráfico y=x2 con su primera derivada. Las extensiones permitidas se describen a continuación:
N
La función se guardará pero no se dibujará. Puede utilizarse como cualquier otra función predefinida o definida por el usuario.
A1
El gráfico de la derivada de la función se dibujará adicionalmente con el mismo color pero con línea más fina.
A2
El gráfico de la segunda derivada de la función se dibujará adicionalmente con el mismo color pero con una línea más fina.
D[a,b]
Asigna el dominio para el que se mostrará la función.
P[a{,b...}]
Indica el conjunto de valores de un grupo de parámetros para los que la función debería mostrarse. Por ejemplo: f(x,k)=kx;P[1,2,3] dibujará las funciones f(x)=x, f(x)=2x, f(x)=3*x. También puede utilizar funciones como argumentos de la opción P.
Tenga en cuenta que también puede realizar todas estas operaciones editando los elementos de la pestaña Derivadas, la sección Intervalo de gráfico personalizado y la sección Parámetros de la barra lateral Funciones.

Everything you need to know to start using Linux and its applications, one of the most prominent examples of free software. Guides, tutorials and news of interest about Linux, the most robust operating system in existence.
Today with the penultimate publication of this small guide dedicated to KmPlot.
In this case we will dedicate to the syntax and extensions.
Some syntax rules must follow the following structure:
name(var1[, var2])=term [;extensions]
name
The name of the function. If the first character is "r", the parser assumes you are using polar coordinates.
If the first character is "x" (e.g. "xfunc"), the parser expects a second function starting with "y" (hence "yfunc") to define the function parametrically.
var1
The variable of the function.
var2
The "group parameter" function. It must be separated from the function variables by a comma. You can use the group parameter to, for example, plot multiple graphs from one function. The parameter value can be selected manually, or you can choose to use a slider bar to control a given parameter. When you change the value of the slider bar, the value of the parameter will change accordingly. The slider can take integer values from 0 to 100.
term
The expression that defines the function.
Predefined names of functions and constants.
All predefined functions and constants known to KmPlot are shown by selecting Help → Predefined Mathematical Functions, which displays this page of the KmPlot manual.
These functions and constants, and almost all user-defined ones can be used to determine axis preferences as well. See "Axis Configuration".
Trigonometric functions.
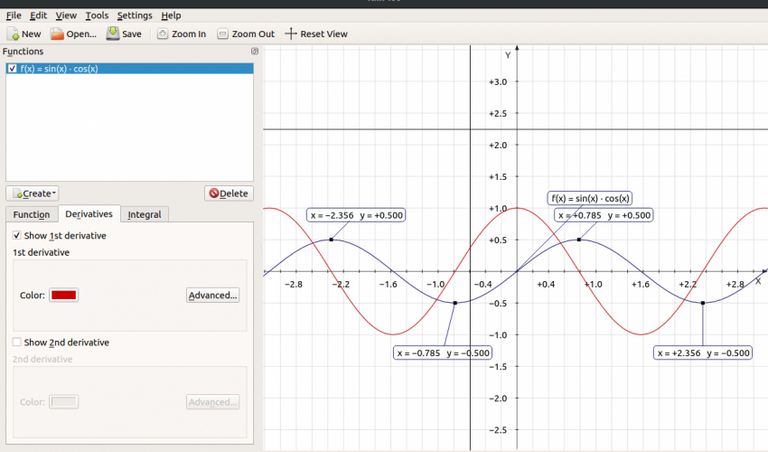
By default the trigonometric functions work in radians. However, you can change this through > Preferences → Configure KmPlot.
sin(x), arcsin(x), cosec(x), arccosec(x).
Return the sine, arcsin, cosecant and arcsin(x) respectively.
cos(x), arccos(x), sec(x), arcsec(x)
Return, respectively, cosine, arccosine, secant and arcsecant.
tan(x), arctan(x), cot(x), arccot(x)
They return, respectively, the tangent, the arctangent, the cotangent and the arcocotangent.
Hyperbolic functions.
The hyperbolic functions.
sinh(x), arcsinh(x), cosech(x), arccosech(x).
They return, respectively, the hyperbolic sine, the arcsine, the cosecant and the arccosecant.
cosh(x), arccosh(x), sech(x), arcsech(x)
Return, respectively, the hyperbolic cosine, arccosine, secant and arcsecant.
tanh(x), arctanh(x), coth(x), arccoth(x)
They return, respectively, the hyperbolic tangent, the arctangent, the cotangent and the arcocotangent.
Other functions.
sqr(x)
The square x^2 of x.
sqrt(x)
The square x^2 of x.
sqrt(x)
The square root of x.
sign(x)
The sign of x. Returns 1 if x is positive, 0 if it is zero, or -1 if x is negative.
H(x)
The unit step function. Returns 1 if x is positive, 0.5 if x is zero, or 0 if x is negative.
exp(x)
The exponent e^x of x.
ln(x)
The natural algorithm (inverse exponent) of x.
log(x)
The base 10 logarithm of x.
abs(x)
The absolute value of x.
floor(x)
Rounds x to the nearest integer less than or equal to x.
ceil(x)
Rounds x to the nearest integer greater than or equal to x.
round(x)
Rounds x to the nearest integer.
gamma(x)
The gamma function.
factorial(x)
The factorial of x.
min(x1,x2,...,xn)
Returns the minimum of a set of numbers {x1,x2,...,xn}.
max(x1,x2,...,xn)
Returns the maximum of a set of numbers {x1,x2,...,xn}.
mod(x1,x2,...,xn)
Returns the modulus (Euclidean length) of a set of numbers {x1,x2,...,xn}.
Predefined constants.
pi, π
Constants representing π (3.14159...).
e
Constant representing the Euler number e (2.71828...).
Extensions.
An extension for a function is specified by entering a semicolon followed by the extension after the function definition. The extension can be written using the D-Bus parser addFunction method. None of the extensions will be available for parametric functions, but N and D[a,b] work for polar functions as well. For example:
f(x)=x^2; A1
will display the graph y=x2 with its first derivative. The allowed extensions are described below:
N
The function will be saved but not drawn. It can be used as any other predefined or user-defined function.
A1
The graph of the derivative of the function will be additionally drawn with the same color but with thinner line.
A2
The graph of the second derivative of the function will be additionally drawn with the same color but with a thinner line.
D[a,b]
Assigns the domain for which the function will be displayed.
P[a{,b...}]
Indicates the set of values of a parameter set for which the function should be displayed. For example: f(x,k)=kx;P[1,2,3] will draw the functions f(x)=x, f(x)=2x, f(x)=3*x. You can also use functions as arguments of the P option.
Note that you can also perform all these operations by editing the items in the Derivatives tab, the Custom Graph Interval section and the Parameters section of the Functions sidebar.
Instalar en Linux / Linix install.
Home Page oficial del proyecto: /Official home page of the project: KmPlot.
Screenshots / Capturas de pantallas:
| Blogs, Sitios Web y Redes Sociales / Blogs, Webs & Social Networks | Plataformas de Contenidos/ Contents Platforms |
|---|---|
| Mi Blog / My Blog | Los Apuntes de Tux |
| Red Social Twitter / Twitter Social Network | @hugorep |
