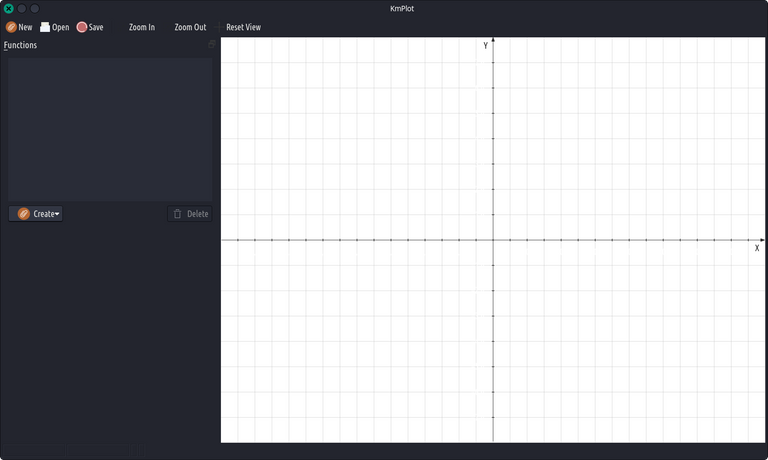
Sigo desarrollando la guia de este estupendo programa para representar funcionar.
Libre y gratuita, opensource al ciento por ciento, en el mejor estilo del software libre.
Hoy voy a compartir con todos los #blurtians aficionados al software libre un post dedicado a los distintos modos de comb inar las funciones.
Veo que el colega @nalexadre, estupendo desarrollador del nuevo frontend #Beblurt (que desgraciadamente todavía no puedo usar en mi Xubuntu) ha implementado nuevas aplicaciones con librerías opensource.
Compartir es la norma, contenidos y conocimientos. Los derechos de autor van perteneciendo cada vez a una elite reducida que no tiene cabida en estas plataformas.
Vamos con #Blurt!!!
Combinar funciones.
Se pueden combinar funciones para crear otras nuevas. Simplemente, escriba las funciones tras el signo igual en una expresión, de la misma forma que si las funciones fueran variables. Por ejemplo, si ha definido las funciones f(x) y g(x), puede representar la suma de f y g con:
sum(x) = f(x) + g(x)
Cambiar la apariencia de las funciones.
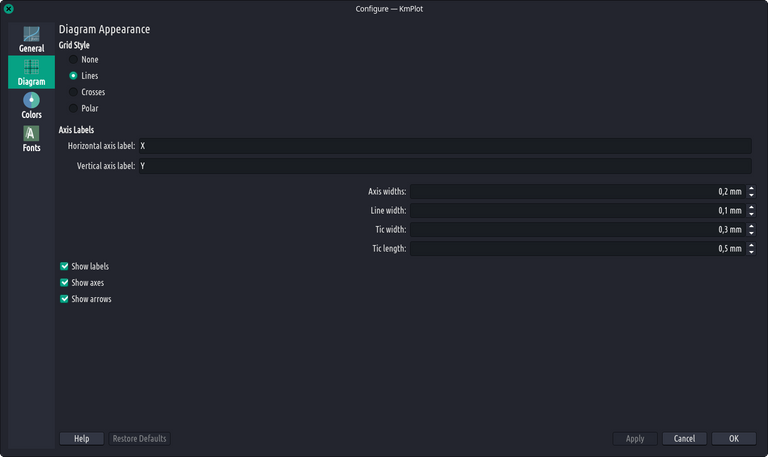
Para cambiar el aspecto de un gráfico de una función en la ventana de dibujo principal, seleccione la función en la barra lateral Funciones. Puede cambiar el ancho de la línea, su color y varios elementos más pulsando los botones Color y Avanzado... que hay en la parte inferior de la sección
Aspecto.
Si estuviera editando una función explicita, vería un diálogo con tres pestañas. En la primera puede especificar la ecuación de la función. La pestaña Derivadas permite dibujar la primera y segunda derivada de la función. Con la pestaña Integral puede dibujar la integral de la función.
Menú desplegable.

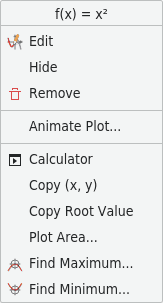
Menú emergente del botón derecho sobre el gráfico.
Cuando pulse con el botón derecho sobre el gráfico de una función o sobre un punto único en el gráfico de una función paramétrica, aparecerá un menú desplegable. En el menú existen tres elementos disponibles:
Editar.
Selecciona la función en la barra lateral Funciones para editarla.
Ocultar
Oculta el gráfico seleccionado. Mientras que los demás gráficos seguirán siendo visibles.
Eliminar.
Elimina la función y todos los gráficos que estén asociados a ella.
Animar gráfico.
Muestra el diálogo Parámetro de animación.
Calculadora
Abre el diálogo de la Calculadora.
Dependiendo del tipo de gráfico, pueden existir cuatro herramientas disponibles:
Área del gráfico.
Selecciona los valores x mínimo y máximo para el gráfico en el nuevo diálogo que aparecerá. Calcula la integral y dibuja el área entre el gráfico y el eje x en el intervalo seleccionado en el color del gráfico.
Encontrar mínimo.
Busca el valor mínimo de la función, en un rango especificado. El gráfico seleccionado se resaltará en el diálogo que aparece. Introduzca los límites inferior y superior de la región en la cual desea buscar un valor mínimo.
Nota: También puede indicar al gráfico que muestre visualmente los puntos extremos en el diálogo Aspecto del gráfico, al que acceder en la barra lateral Funciones, pulsando en Avanzado....
Encontrar máximo.
Actúa de la misma forma que Encontrar mínimo..., pero busca el valor máximo en lugar del mínimo.

I am still developing the guide of this great program to represent it working.
Free and free, one hundred percent opensource, in the best free software style.
Today I'm going to share with all #blurtians who love free software a post dedicated to the different ways to combine the functions.
I see that my colleague @nalexadre, great developer of the new #Beblurt frontend (which unfortunately I still can't use on my Xubuntu) has implemented new applications with opensource libraries.
Sharing is the norm, content and knowledge. Copyrights are increasingly belonging to a reduced elite that has no place in these platforms.
Let's go with #Blurt!
Combine functions.

You can combine functions to create new ones. Simply write the functions after the equal sign in an expression, in the same way as if the functions were variables. For example, if you have defined the functions f(x) and g(x), you can represent the sum of f and g with:
sum(x) = f(x) + g(x).
Changing the appearance of functions.
To change the appearance of a function graph in the main drawing window, select the function in the Functions sidebar. You can change the width of the line, its color and several other elements by clicking on the Color and Advanced... buttons at the bottom of the
Appearance.
If you were editing an explicit function, you would see a dialog with three tabs. In the first one you can specify the equation of the function. The Derivatives tab allows you to draw the first and second derivatives of the function. With the Integral tab you can draw the integral of the function.
Popup menu
Right-click popup menu on the graph.
When you right-click on the graph of a function or on a single point on the graph of a parametric function, a pop-up menu appears. Three items are available in the menu:
Edit.
Select the function in the Functions sidebar to edit it.
Hide
Hides the selected graph. While the other graphs will remain visible.
Delete.
Deletes the function and all charts associated with it.
Animate graphic.
Displays the Animation Parameter dialog.
Calculator
Opens the Calculator dialog.
Depending on the type of chart, four tools may be available:
Chart Area.
Selects the minimum and maximum x-values for the graph in the new dialog that appears. Calculates the integral and draws the area between the graph and the x-axis in the selected interval in the graph color.
Find minimum.
Searches for the minimum value of the function, in a specified range. The selected graph will be highlighted in the dialog that appears. Enter the lower and upper limits of the region in which you want to search for a minimum value.
Note: You can also instruct the graph to visually display the extreme points in the Graph Appearance dialog, which can be accessed in the Functions sidebar by clicking on Advanced.....
Find maximum.
Acts in the same way as Find minimum..., but looks for the maximum value instead of the minimum.


Home Page oficial del proyecto: /Official home page of the project: Nagios.
Screenshots / Capturas de pantallas:
| Blogs, Sitios Web y Redes Sociales / Blogs, Webs & Social Networks | Plataformas de Contenidos/ Contents Platforms |
|---|---|
| Mi Blog / My Blog | Los Apuntes de Tux |
| Red Social Twitter / Twitter Social Network | @hugorep |

Dear @hugo1954, your content was selected manually by curators @nalexadre, @ten-years-before to receive a curation from BeBlurt 🎉
Thank you for constantly curating and supporting my content @beblurt. My congratulations to @nalexadre.