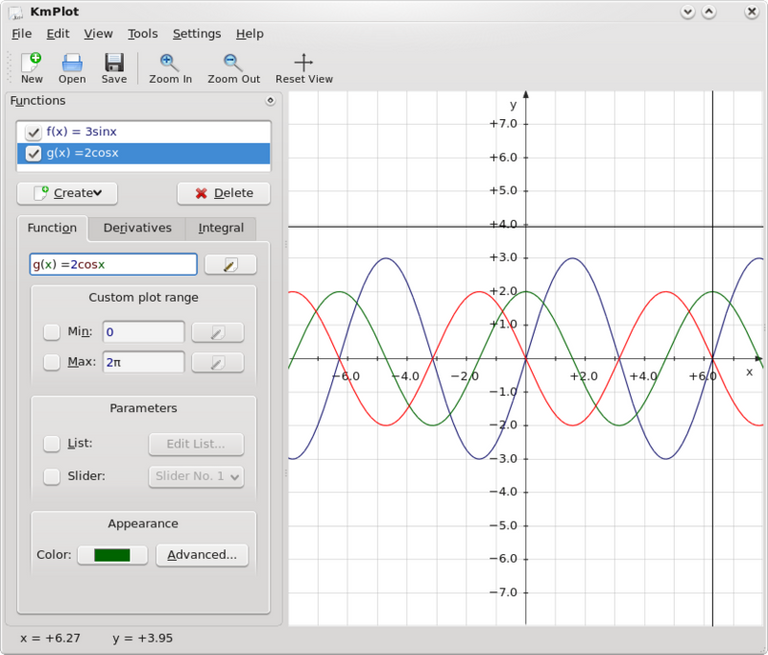
En el primer post dedicado a KmPlot hace días pasados en esta comunidad, les hice una introducción a este programa para dibujar gráficas de funciones, sus integrales o sus derivadas.
Las gráficas pueden tener color y contienen muchas opciones.
KmPlot incluye varios tipos de funciones diferentes, que pueden forma de función o como una ecuación.
También se pueden escribir gráficos cartesianos como, p. ej., «y = x^2», donde x se utilizará como una variable, o como p. ej., «f(a) = a^2», donde el nombre de la variable es arbitrario.
Los gráficos cartesianos son similares a los gráficos cartesianos. Las coordenadas x e y puede introducirse como ecuaciones en t, p. ej. «x = sin(t)», «y = cos(t)», o como funciones, p. ej. «f_x = sin(s)», «f_y(s) = cos(s)».
Los gráficos polares son similares a los gráficos cartesianos. Pueden introducirse como una ecuación en θ, p. ej. «r = θ», o como una función, p. ej. «f(x) = x».
Para los gráficos implícitos, el nombre de la función se introduce por separado en la expresión relacionada de las coordenadas x e y. Si las variables x e y se especifican a través del nombre de función (introduciendo p. ej. «f(a,b)» como nombre de función), se utilizarán estas variables. Sino, se utilizarán las letras x e y como variables.
Los gráficos diferenciales explícitos son ecuaciones diferenciales a través de la derivada superior dada en términos de derivadas inferiores. La diferenciación se denota con una prima («). En forma de función, la ecuación se parecerá a algo como «f''(x) = f» − f». En forma de ecuación, se parecerá a algo como «y'' = y« − y». Observe que en ambos casos, la parte «(x)» no se añade a los términos diferenciales de orden inferior (por tanto debe introducir «f»(x) = −f» y no «f'(x) = −f(x)».
Todos los cuadros de introducción de ecuaciones incluyen un botón a su derecha. Pulsar este botón llama al diálogo del Editor de ecuaciones, que proporciona:
Una variedad de símbolos matemáticos que puede utilizarse en las ecuaciones, pero que no se encuentran en los teclados normales.
La lista de constantes de usuario y un botón para editarlas.
La lista de funciones predefinidas. Observe que si ha seleccionado texto, se utilizará como argumento de la función cuando ésta se inserte. Por ejemplo, si se selecciona «1 + x» en la ecuación «y = 1 + x», y se inserta la función seno, la ecuación resultante será: «y = sin(1+x)».
Tipos de funciones.
Funciones cartesianas.
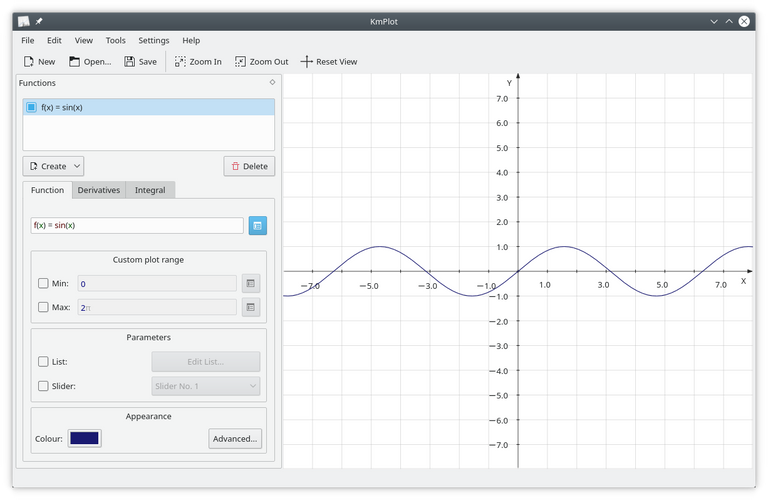
Para introducir una función explícita (es decir, una función de la forma y=f(x)) en KmPlot, introdúzcala de la siguiente forma:
f(x) = expresión
donde:
f es el nombre de la función, y puede ser cualquier cadena de letras y números.
x es la coordenada x que se usará en la expresión que sigue al signo igual. Es, de hecho, una variable, así que puede usar cualquier nombre de variable que desee, aunque el efecto será el mismo.
expresión es la expresión que se va a representar, dada en la sintaxis adecuada para KmPlot. Consulte “Sintaxis matemática”.
Funciones paramétricas.
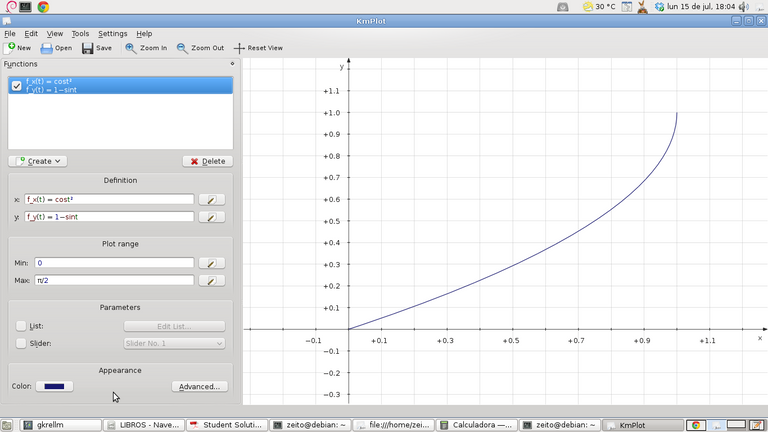
Las funciones paramétricas son aquellas en las que las coordenadas x e y se definen en funciones separadas de otra variable, llamada habitualmente t. Para introducir una función paramétrica en KmPlot, siga el procedimiento para una función cartesiana para cada una de las funciones x e y. Al igual que en las funciones cartesianas, puede utilizar cualquier nombre de variable que desee para el parámetro.
Como ejemplo, suponga que desea dibujar un círculo, que tiene como ecuaciones paramétricas x = sin(t), y = cos(t). Después de crear un gráfico paramétrico, introduzca las ecuaciones adecuadas en los cuadros x e y, es decir, f_x(t)=sin(t) y f_y(t)=cos(t).
Puede configurar algunas opciones adicionales para el gráfico en el editor de la función:
Mín, Máx
Estas opciones controlan el rango del parámetro t para los que la función se dibuja.
Funciones en coordenadas polares.
Las coordenadas polares representan un punto por su distancia al origen (normalmente llamada «r») y el ángulo que forma con el eje X una línea que va desde el origen hasta el punto (normalmente representado por θ, la letra griega zeta). Para introducir funciones en forma de coordenadas polares, pulse el botón Crear y seleccione Gráfico polar en la lista. En el cuadro de la definición, complete la definición de la función, incluyendo el nombre de la variable zeta que vaya a utilizar; p. ej., para dibujar la espiral de Arquímedes r = θ, introduzca:
r(θ) = θ
Recuerde que puede usar cualquier nombre para la variable zeta, de modo que «r(t) = t» o «f(x) = x» producirían exactamente el mismo resultado.
Funciones implícitas.
Una expresión implícita relaciona las coordenadas x e y como una igualdad. Para crear un círculo, por ejemplo, pulse el botón Crear y seleccione Gráfico implícito en la lista. Luego, en el cuadro de la ecuación (debajo del cuadro que contiene el nombre de la función), introduzca lo siguiente:
x^2 + y^2 = 25
Funciones diferenciales.
KmPlot puede dibujar ecuaciones diferenciales. Estas son ecuaciones de la forma y(n) = F(x,y',y'',...,y(n−1)), donde yk es la késima derivada de y(x). KmPlot solo puede interpretar el orden de derivada como el número de primas siguiendo al nombre de la función. Para dibujar una curva sinusoidal, por ejemplo, podría utilizar la ecuación diferencial y'' = − y o f''(x) = −f.
Sin embargo, una ecuación diferencial por sí sola no es suficiente como para determinar un punto. Cada curva en el diagrama se genera por una combinación de la ecuación diferencial y las condiciones iniciales. Puede editar las condiciones iniciales pulsando en la pestaña Condiciones iniciales tras seleccionar la ecuación diferencial. El número de columnas proporcionado para editar las condiciones iniciales depende del orden de la ecuación diferencial.
Puede configurar algunas opciones adicionales para el gráfico en el editor de la función:
Paso:
El valor del paso en el cuadro precisión se utiliza para resolver numéricamente las ecuaciones diferenciales (utilizando el método Runge Kutta). Su valor es el tamaño de paso máximo. Un paso pequeño puede utilizarse si parte del gráfico diferencial se amplía lo suficiente.
Nos vemos en el proximo post dedicado a KmPlot amigos #blurtians.

In the first post dedicated to KmPlot a few days ago in this community, I made an introduction to this program for drawing graphs of functions, their integrals or their derivatives.
The plots can be colored and contain many options.
KmPlot includes several different types of functions, which can be in the form of a function or as an equation.
Cartesian plots can also be written as, e.g., "y = x^2", where x will be used as a variable, or as e.g., "f(a) = a^2", where the variable name is arbitrary.
Cartesian plots are similar to Cartesian plots. The x and y coordinates can be entered as equations in t, e.g. "x = sin(t)", "y = cos(t)", or as functions, e.g. "f_x = sin(s)", "f_y(s) = cos(s)".
Polar graphs are similar to Cartesian graphs. They can be entered as an equation in θ, e.g. "r = θ", or as a function, e.g. "f(x) = x".
For implicit graphs, the function name is entered separately in the related expression of the x and y coordinates. If the variables x and y are specified via the function name (by entering e.g. "f(a,b)" as function name), these variables are used. Otherwise, the letters x and y will be used as variables.
Explicit differential graphs are differential equations through the upper derivative given in terms of lower derivatives. The differentiation is denoted by a prime ("). In function form, the equation will look something like "f''(x) = f" - f". In equation form, it will look something like "y'' = y" - y". Note that in both cases, the "(x)" part is not added to the lower order differential terms (so you must enter "f"(x) = -f" and not "f'(x) = -f(x)".
All equation input boxes include a button to the right of them. Clicking this button calls the Equation Editor dialog, which provides:
A variety of mathematical symbols that can be used in equations, but are not found on normal keyboards.
The list of user constants and a button to edit them.
The list of predefined functions. Note that if you have selected text, it will be used as the function argument when the function is inserted. For example, if you select "1 + x" in the equation "y = 1 + x", and insert the sine function, the resulting equation will be: "y = sin(1+x)".
Types of functions.
Cartesian functions.
To enter an explicit function (i.e., a function of the form y=f(x)) in KmPlot, enter it as follows:
f(x) = expression
where:
f is the name of the function, and can be any string of letters and numbers.
x is the x-coordinate to be used in the expression following the equals sign. It is, in fact, a variable, so you can use any variable name you wish, although the effect will be the same.
expression is the expression to be represented, given in the appropriate syntax for KmPlot. See "Mathematical syntax".
Parametric functions.
Parametric functions are those in which the x and y coordinates are defined in separate functions of another variable, usually called t. To enter a parametric function in KmPlot, follow the procedure for a Cartesian function for each of the x and y functions. As with Cartesian functions, you can use any variable name you wish for the parameter.
As an example, suppose you want to draw a circle, which has as parametric equations x = sin(t), y = cos(t). After creating a parametric plot, enter the appropriate equations in the x and y boxes, i.e. f_x(t)=sin(t) and f_y(t)=cos(t).
You can set some additional options for the graph in the function editor:
Min, Max
These options control the range of the parameter t for which the function is plotted.
Functions in polar coordinates.
Polar coordinates represent a point by its distance from the origin (usually called "r") and the angle that a line from the origin to the point makes with the X-axis (usually represented by θ, the Greek letter zeta). To enter functions in the form of polar coordinates, click the Create button and select Polar Graph from the list. In the Definition box, complete the function definition, including the name of the zeta variable to be used; e.g., to draw the Archimedean spiral r = θ, enter:
r(θ) = θ
Remember that you can use any name for the zeta variable, so "r(t) = t" or "f(x) = x" would produce exactly the same result.
Implicit functions.
An implicit expression relates the x and y coordinates as an equality. To create a circle, for example, click the Create button and select Implicit Graph from the list. Then, in the equation box (below the box containing the function name), enter the following:
x^2 + y^2 = 25
Differential functions.
KmPlot can draw differential equations. These are equations of the form y(n) = F(x,y',y'',...,y(n-1)), where yk is the kth derivative of y(x). KmPlot can only interpret the derivative order as the number of primes following the function name. To draw a sinusoidal curve, for example, you could use the differential equation y'' = - y or f''(x) = -f.
However, a differential equation alone is not sufficient to determine a point. Each curve in the diagram is generated by a combination of the differential equation and the initial conditions. You can edit the initial conditions by clicking on the Initial Conditions tab after selecting the differential equation. The number of columns provided for editing the initial conditions depends on the order of the differential equation.
You can set some additional options for the graph in the function editor:
Step:
The step value in the precision box is used to solve differential equations numerically (using the Runge Kutta method). Its value is the maximum step size. A small step can be used if part of the differential graph is sufficiently enlarged.
See you in the next post dedicated to KmPlot fellow #blurtians.


Home Page oficial del proyecto: /Official home page of the project: KmPlot.
Screenshots / Capturas de pantallas:
| Blogs, Sitios Web y Redes Sociales / Blogs, Webs & Social Networks | Plataformas de Contenidos/ Contents Platforms |
|---|---|
| Mi Blog / My Blog | Los Apuntes de Tux |
| Red Social Twitter / Twitter Social Network | @hugorep |
