
Hello everyone and welcome to my blog.
A lot of things are regarded as basics when it comes to trading and technical analysis and as such most newbies pay less attention to them and want to jump into knowing the so called money hack strategies.
The fact still remains that it is impossible to be a successful trader without properly going through the basics and mastering them to the point that you need not to stare too long on the chart before you spot them.
This necessity is what that has brought about this topic whereby we will be looking at the support and resistance on the price chart.

The support area can be regarded as areas on the price chart where there are strong buying pressure on a particular asset. This areas tend to reverse or pullback prices upwards which indicates a switch in market control from the hands of sellers to that of buyers.
Traders who spot these areas often take advantage of them buy setting a buy order or wait for prices to actually reverse before taking a buy position.
There are three different types of support and they are;
- Horizontal support
- Vertical support
- Dynamic support
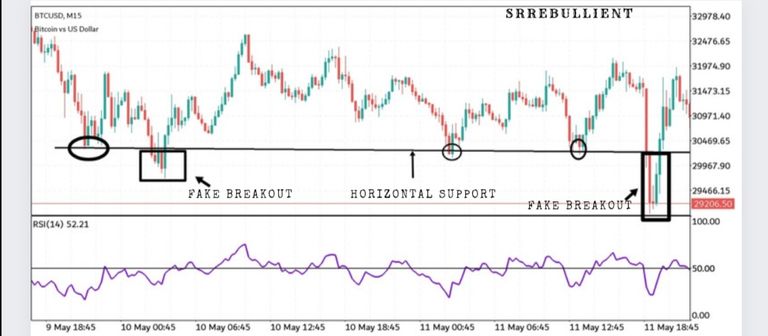
Horizontal support are those horizontal areas on the price chart that holds price from going further down due to strong buying pressure on those areas.
They serve several purposes such as providing buying signal when combined with other technical analysis tools. They also serve as exit strategy buy allow traders to set stop-losses just below them in other to minimize loss should the support fail to reverse or pullback price.
- See below
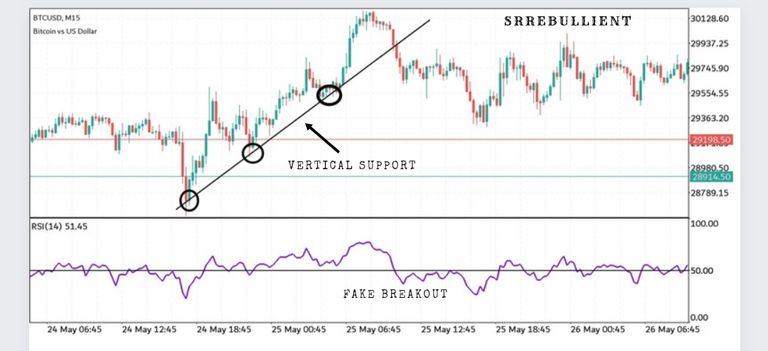
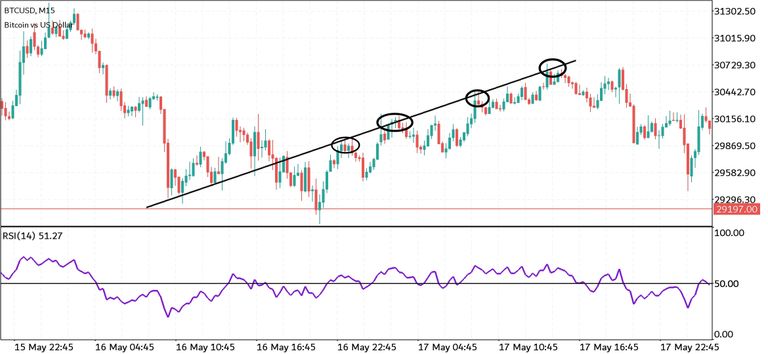
The vertical support is the type of support that is usually found in a trending market. It serves to prevent price from breaking away from a trend thus maintaining its higher high or lower low formation.
The vertical support also serves to provide traders with a lot of good entry signals as it allows them to take advantage of price pullback once it hits the support. Of cause this is done with the aid of other technical analysis tool in other to properly identify when the vertical support is already weak.
- See below
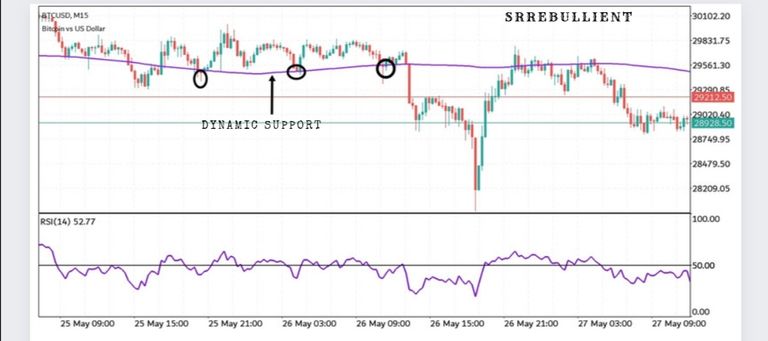
This are areas where by the price tend to pull back or reverse without being in a vertical or horizontal support. It is usually identified using the moving average indicators.
Traders tend to utilize this support regions in making a bullish entry or a bearish target because of the constant pullback of prices once it gets to these regions.
These entries are best made with the aid of other technical analysis tools in other to escape fake reversals.
The resistance area is regarded as the area on the price chart whereby the price find it difficult to break above due to strong selling pressure.
This area always tend to reverse price at this region because based on the historical occurrence, sellers have already positioned at this regions in other to take control of the market and at the same time most buys tend to exit their position due to fear that the price will reverse at those points and this in turn leads to an actual price reversal.
Similar to support, there are three types of resistance and they are ;
- Horizontal resistance
- Veritical resistance
- Dynamic resistance
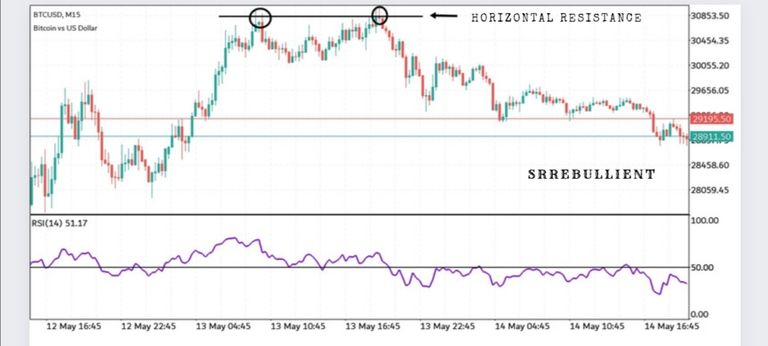
This is the most common type of resistance which is holds pride from moving further upwards due to strong selling pressure.
These areas provide selling signals for traders when combined with other technical analysis tools because they tend to reverse or bullish back bullish prices thus allowing traders to utilize the opportunity in taking sell positions.
- See below
Vertical resistance is just similar but opposite to vertical support. It is a type of resistance that is mostly seen on trending markets.
This type of resistance keeps the price from breaking the trend thus allowing it to continue in its lower low or higher high formation which depends on the direction of the trend.
- See below
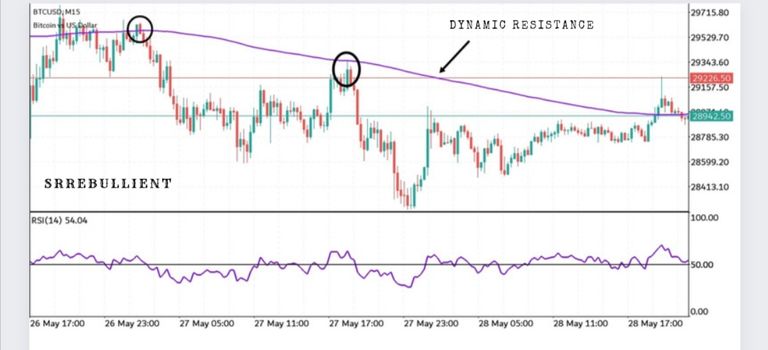
The dynamic resistance are those areas on price chart whereby prices tend to pullback or reverse without being on a horizontal resistance. This areas are usually identified using Moving average indicators and they also serve as good entry points when compianed with other technical analysis tools.
- See below
The support and resistance areas are very important regions on the price chart because they help traders in identifying where there are high buying and selling pressure in the market. This act is based on the fact that history always tend to repeat itself and this mindset in turn affects trader's psychology which makes them to often exit or enter the market on regions where price hsve previously reversed.
It is always important to note that the support and resistance areas are not by chance regarded as areas of regions instead of lines and this is because price doesn't often reverse or pullback at exact straight lines as it most times slightly surpass the previous positions but maintains its region.
Thanks for reading..
Do vote @Blurt.Live as your Witness
Posted from https://blurt.live