A) EXPLAIN THE JAPANESE CANDLESTICK CHART? (ORIGINAL SCREENSHOT REQUIRED).
B) IN YOUR OWN WORDS, EXPLAIN WHY THE JAPANESE CANDLESTICK CHART IS THE MOST USED IN THE FINANCIAL MARKET.
C) DESCRIBE A BULLISH AND A BEARISH CANDLE. ALSO, EXPLAIN ITS ANATOMY. (ORIGINAL SCREENSHOT REQUIRED)
The candle stick is a kind of chart which is base on price indication of ductation which shows or indicates the the price action with the support and assistant of the opening, closing, high and low price points which is independent of time, this was initiated and figured out by a rice merchants in japan
by a man named Steve Nison in 1990s.
Meanwhile the japanese candlestick is basically made for technical analysis,which which is used to determine the price movement based on the assets involved based on their security.
Meanwhile the candlestick is pictured to have a graphical representation which details and shows the direction of the market flow by indicating it with two basic colour "Red and Blue or white and black" as the case May be, hence this is utilized to make entry and exit in the market based on the market trends in the chart.
Therefore the the candle astick is manufactured to dictate and predict the next move of the market.
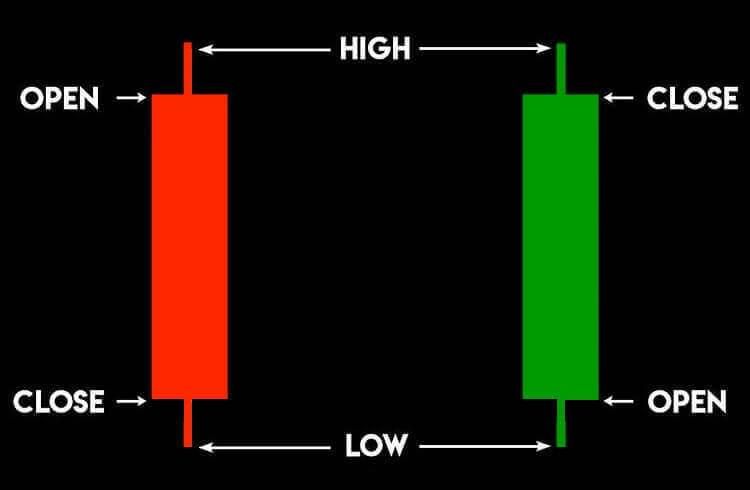
OPEN: This is the price point where by the candle start with respect to time.
HIGH: This is known at peak reached by the price or attained by the asset with respect to time.
LOW: This is the lowest point of price reached by a particular asset with respect to a speculated time frame.
CLOSE: This is the price which ends the asset at agiven time frame.
Onserving the market with chart, the Japanese candle chart are the most used chart in the financial sector when compared to the likes of the bar chat, hence the trader prefers the use of the japanese candle stick than any other with the follow reasons.
Hence based on the full Japanese candle stick signify a complete information, hence this has the Hammer, the doji, the wicks,, hence all this has it own signal passing to the trader as informatiom, informing him the next step to take in the market, hence this signify the inner happening in market based on security.
Hence based on this point of view the candle sticks are flexible in such a way that, it can be used to show the timing based on individual candle difference, which can be set on ( 1 week, 1 day, 1 hour, 1 minutes and others), hence this actually shows the time frame of a single candle depending on how is being configured.
Hence some of the traders fancy the collaboration movement of the candle sticks with the likes of the indicator Moving Average Convergence Divergence (MACD), Simple Moving Average (SMA),
Relative Strength Indicator (RSI), Exponential (EMA) and many others, hence all the indicator predict and follow the trend and fugure out what the future holds for the market. And this serves as a guilds towards the entry and exist of a market.
The japanese candlestick chart is quit understable to the knowledge of any one, who take a critical view on it, can vitualize and report the internal happening of the market with the help of the individual colour difference.
This Japanese candle stick actually asssit to visualize the market trend and that of the security behind the scene of the market at a particular time, or time frame, hence this assist the traders to get close information on the comfortabilty of the market, which helps to known when to enter and exist the market ro avoid lose.
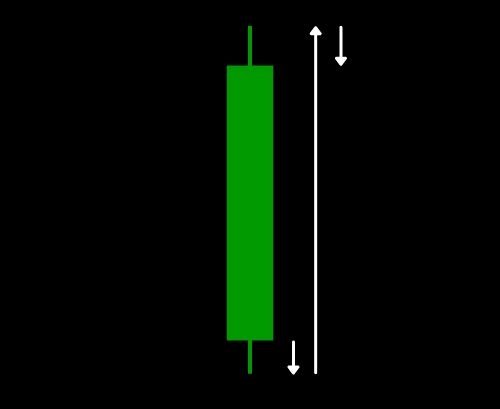
Hence the bullish candle is when the close is set to be higher above that of the open which is shown or indicated by green or white candle with respect of time frame also the close is always above the open, which obtain interest when ever the price is set to go high above it's starting point, hence this is set to happened on the green candle.
For an example let assume you bought an asset at the a $150 with a time frame of 1 day which is represent as one candle and sell it when the price $200 after 18 hours interval and it was sold there by making a gain of $50 extral from your investment.
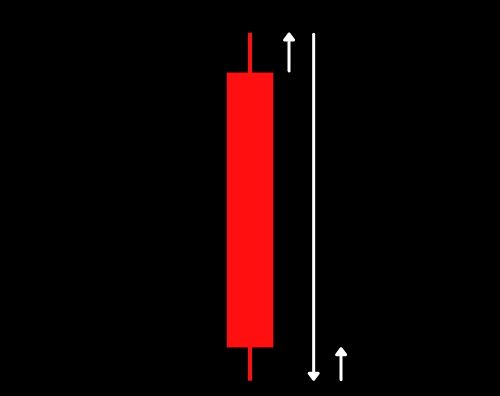
The Bearish candlestick is a point at which the close is set to be at a lower point of the opening with respect to the time frame, hence the asset is set to loose it value once it goes below the the starting point and therefore this is signified with the red of black candlestick.
In conclusion the candle pattern has shown how efficient and potential it is, hence this one of the indicators which shows the price action of the market and the liquidity of a particular asset, which is applicable to all market.
#helloblurt #introduceyourself #instablurt #blurtafrica #blurtlife #r2cornell


