SPS (Splintershards) was one of the best performer in July. It went up from 0.016 USD to 0.024 USD in a few days. It pumped 50% in 15 days. Even it was one of the most gainer crypto in July, It went down from 0.024 USD to 0.018 USD while Bitcoin going down from 31K to 26K..
During this price move, a few play to earn crypto in Binance pumped more than 2x... SPS is one of undervalued play to earn crypto. Because it is not listed in Binance yet...
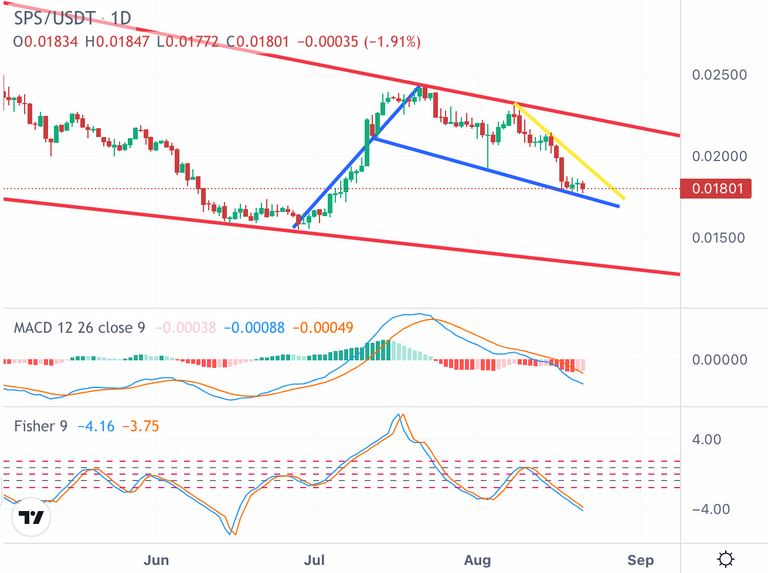
Here you can see descending wedge pattern in SPs price chart. SPS should break up this pattern to finish bearish season. It will be broken up or down until end of this year..

When we look SPS price chart for short term, there is support line drawn as blue and there is downtrend line drawn as yellow. It will be broken up or down until September. It will be the trigger for up or downtrend in short term..
When we look the indicators of SPS price chart, MACD and Fisher Indicators are at god level to reverse. So breaking up yellow downtrend line is possible to see.
I shared a few analysis for Bitcoin and Hive price chart. They may be on the bottom and they may reverse for short term. So, SPS price may hit the top of descending wedge pattern again..
We will see..