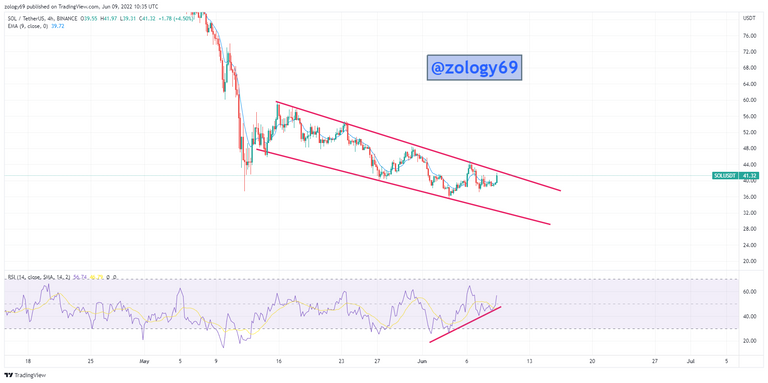
The bear market has lasted almost 3 months and everything on the market has been red since then. Solana, one of the top 10 altcoins has followed in line, steadily making lower highs and lower lows in a descending rectangle conformation.
The screenshot above is a 4h chart of SOLUSDT taken from tradingview
The screenshot above is a 45-min chart of SOLUSDT taken from tradingview. I use this when I want to see clearly the market movement
In the past week, I have scalped SOLUSDT on a 45-min timeframe using market analysis of the rectangle pattern to my advantage. I have been in consistent profit by buying at support when price hits the lower support trendline and selling at the upper resistance trendline just before price reverses to touch support again.
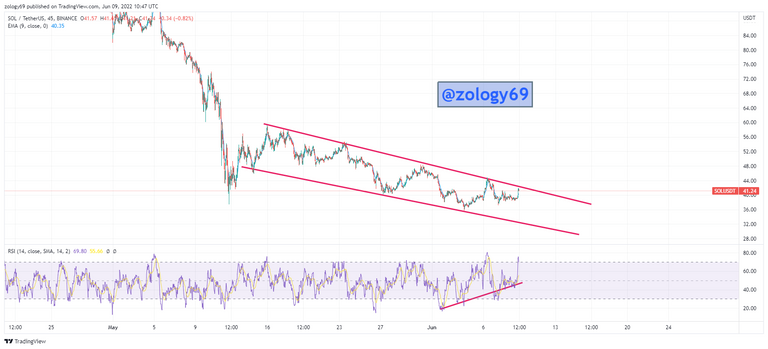
I have a weird feeling the descending rectangle is about to break out in the upward direction real soon. Maybe I should prepare to go long and set a bigger take profit? What do you think? @maarnio, I’d like to hear your opinion.