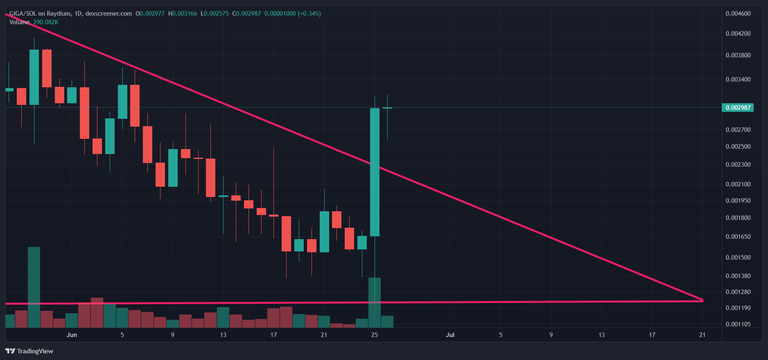
Gigachad (Raydium: GIGAUSD) has broken out of the triangle pattern in the daily chart.
(Chart courtesy of Tradingview.com(log scale))
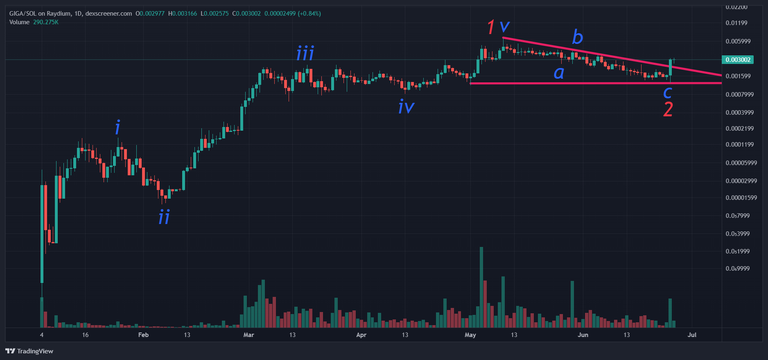
Elliott Wave Analysis
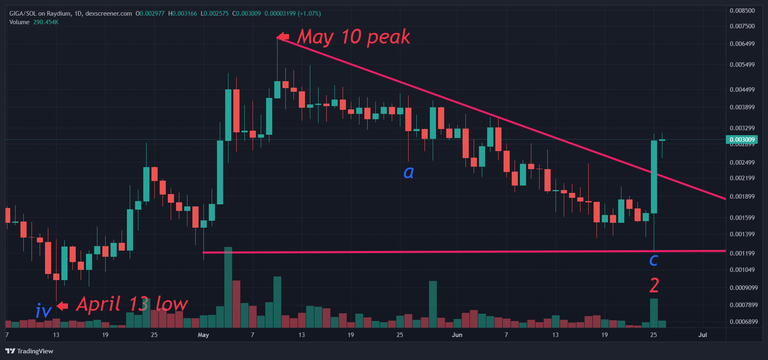
In Elliott Wave terms, GIGA began a red wave one advance on January 4. The red wave one (blue sub-waves i-ii-iii-iv-v) peaked on May 10 and the red wave two (blue sub-waves a-b-c) correction ended on June 25. If this wave count is correct, GIGA should be heading next towards the May 10 peak in the red wave three.
(Chart courtesy of Tradingview.com(log scale))
Funnymentals
Gigachad is based off of a photoshoot of Russian bodybuilder Ernest Khalimov who was coined gigachad for his perfect physique, jawline, and being a symbol of what a peak masculine male should strive for. Know Your Meme has investigated the legend.
(Sources: https://www.gigachadsolana.com/)
How Will Gigachad Trade?
Gigachad (Raydium: GIGAUSD) daily chart by Tradingview.
(Chart courtesy of Tradingview.com(log scale))
Prizes
I will be giving upvotes to the correct answers (posts only).
Rules
This poll will expire in one week. Only one vote per person.
Which one will happen first?
Please select one of the three choices and comment below
GIGA will takeout the May 10 peak
GIGA will drop below the April 13 low
GIGA will stay in a trading range between the April 13 low and the May 10 peak until August 1
GIGA will takeout the May 10 peak
GIGA will drop below the April 13 low