The Graph (CRYPTOCAP: Market Cap GRT) has broken out of the triangle pattern in the monthly chart.

(Chart courtesy of Tradingview.com(log scale))
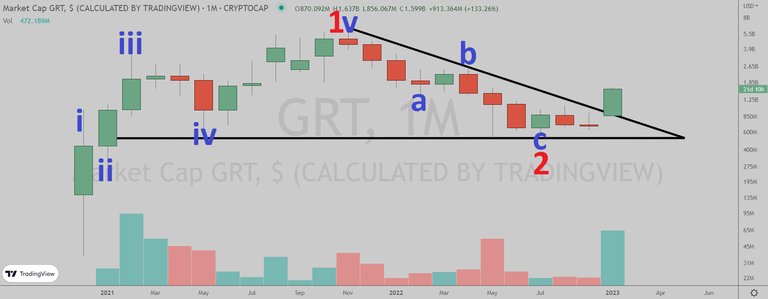
Elliott Wave Analysis
In Elliott Wave terms, GRT began a red wave one advance in December 2020. The red wave one (blue sub-waves i-ii-iii-iv-v) peaked in November 2021 and the red wave two (blue sub-waves a-b-c) correction ended in July 2022. If this wave count is correct, GRT should be heading next towards the November 2021 peak in the red wave three.
(Chart courtesy of Tradingview.com(log scale))
Funnymentals
The Graph is a web3 protocol for organizing and accessing blockchain data. NCashOfficial reviewed the project three weeks ago.
(Sources: https://thegraph.com/)
How Will The Graph Trade?
The Graph (CRYPTOCAP: Market Cap GRT) monthly chart by Tradingview.

(Chart courtesy of Tradingview.com(log scale))
Prizes
I will be giving upvotes to the correct answers (posts only).
Rules
This poll will expire in one week. Only one vote per person.
Which one will happen first?
Please select one of the three choices and comment below.
GRT will takeout the April 2022 peak
GRT will drop below the July 2022 low
GRT will stay in a trading range between the July 2022 low and the April 2022 peak until March 16
GRT will drop below the July 2022 low
GRT will drop below the July 2022 low
GRT will stay in a trading range between the July 2022 low and the April 2022 peak until March 16
Correct.