Slerf (Bitget: SLERFUSDT) has broken out of the triangle pattern in the daily chart.
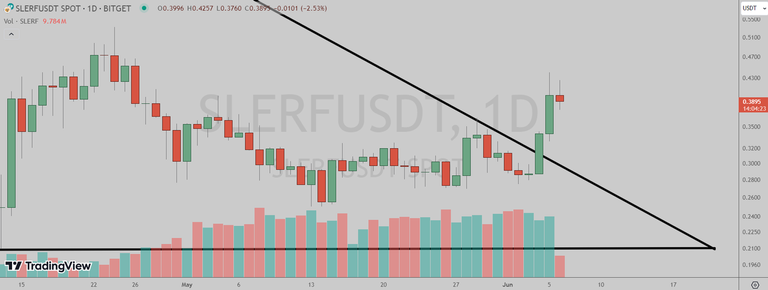
(Chart courtesy of Tradingview.com(log scale))
Elliott Wave Analysis
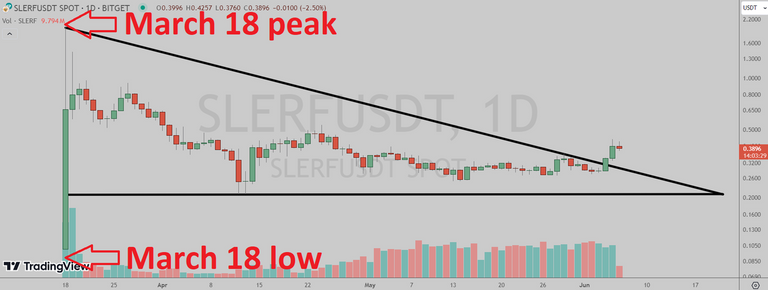
In Elliott Wave terms, SLERF began a red wave one advance on March 18. The red wave one peaked on March 18 and the red wave two (blue sub-waves a-b-c) correction ended on April 13. If this wave count is correct, SLERF should be heading next towards the March 18 peak in the red wave three.

(Chart courtesy of Tradingview.com(log scale))
Funnymentals
"Slerf emerged with a vision to be a fun and engaging meme coin, brimming with exciting content to propel its journey forward. However, on launch day, disaster struck when a major mishap resulted in the accidental burning of $10 million worth of Slerf tokens, intended for distribution among 25,000 trusting presale buyers."
Chris Coffee reviewed the accident two months ago.
(Sources: https://www.slerf.wtf/)
How Will Slerf Trade?
Slerf (Bitget: SLERFUSDT) daily chart by Tradingview.
(Chart courtesy of Tradingview.com(log scale))
Prizes
I will be giving upvotes to the correct answers (posts only).
Rules
This poll will expire in one week. Only one vote per person.
Which one will happen first?
Please select one of the three choices and comment below
SLERF will takeout the March 18 peak
SLERF will drop below the March 18 low
SLERF will stay in a trading range between the March 18 low and the March 18 peak until July 12
Telegram and Whatsapp
You are welcome.
SLERF will stay in a trading range between the March 18 low and the March 18 peak until July 12
Correct. Upvoted your post:
https://blurt.blog/photography/@ace108/6rjgnv-chye-poh-kway-teow-after-walking-the-night-market-video-or-by-ace108
Thank you
You are welcome.
SLERF will drop below the March 18 low