AI Analysis Token (MEXC: AIATUSDT) has broken out of the triangle pattern in the four-hour chart.
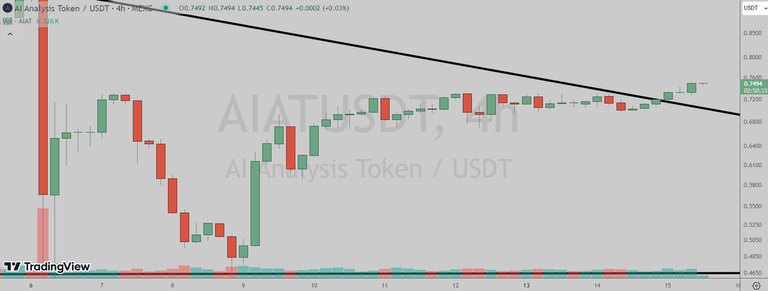
(Chart courtesy of Tradingview.com(log scale))
Elliott Wave Analysis
In Elliott Wave terms, AIAT began a red wave one advance on March 25. The red wave one (blue sub-waves i-ii-iii-iv-v) peaked on May 6 and the red wave two (blue sub-waves a-b-c) correction ended on May 8. If this wave count is correct, AIAT should be heading next towards the May 6 peak in the red wave three.
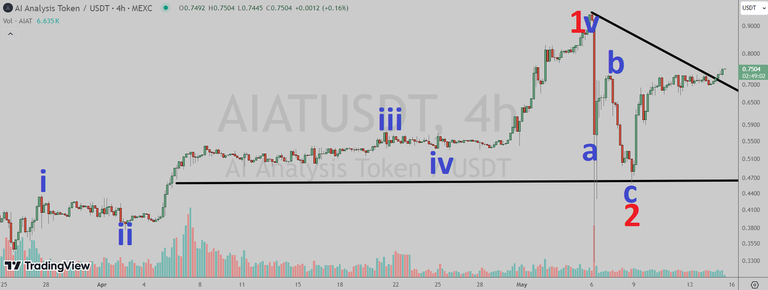
(Chart courtesy of Tradingview.com(log scale))
Funnymentals
AI Analysis was formed by a diverse team from around the world to create a Holistic ecosystem centered around the world of trading and the integration of cutting-edge artificial intelligence technology. You can watch their intro video below.
(Sources: https://aianalysis.group/token/)
How Will AI Analysis Token Trade?
AI Analysis Token (MEXC: AIATUSDT) four-hour chart by Tradingview.
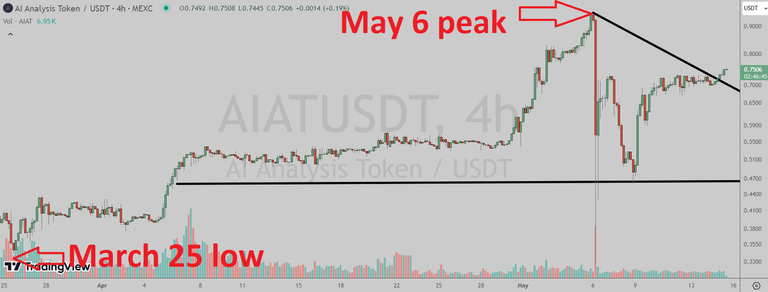
(Chart courtesy of Tradingview.com(log scale))
Prizes
I will be giving upvotes to the correct answers (posts only).
Rules
This poll will expire in one week. Only one vote per person.
Which one will happen first?
Please select one of the three choices and comment below
AIAT will takeout the May 6 peak
AIAT will drop below the March 25 low
AIAT will stay in a trading range between the March 25 low and the May 6 peak until June 20
AIAT will takeout the May 6 peak
AIAT will stay in a trading range between the March 25 low and the May 6 peak until June 20
Correct. Upvoted your post:
https://blurt.blog/blurt-178594/@zessy/3a1fbc-my-phone-photography-of-the-day-28
AIAT will drop below the March 25 low