Tilly The Killer Whale (Raydium: TILLYUSD) has broken out of the triangle pattern in the daily chart.
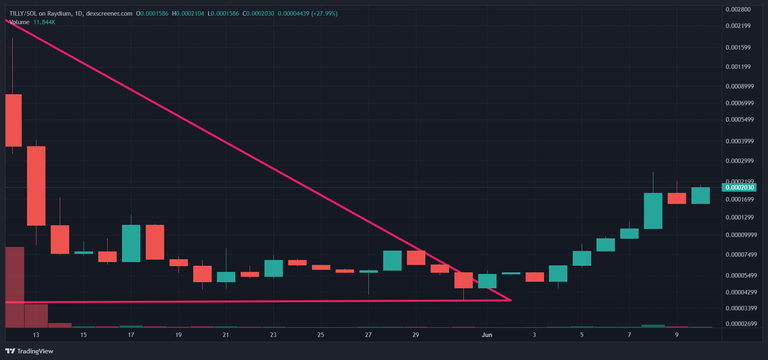
(Chart courtesy of Tradingview.com(log scale))
Elliott Wave Analysis
In Elliott Wave terms, TILLY began a red wave one advance on May 7. The red wave one (blue sub-waves i-ii-iii-iv-v) peaked on May 8 and the red wave two (blue sub-waves a-b-c) correction ended on May 31. If this wave count is correct, TILLY should be heading next towards the May 8 peak in the red wave three.
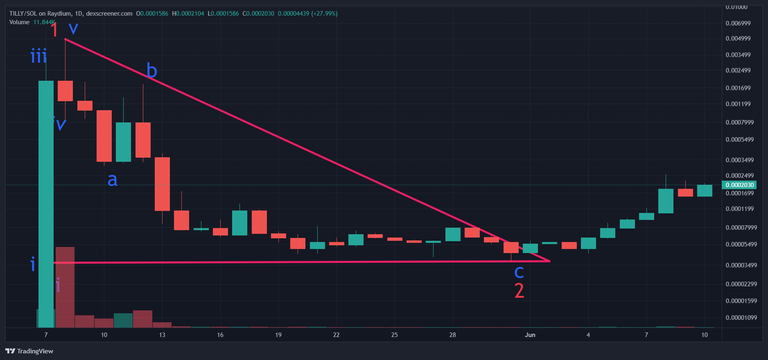
(Chart courtesy of Tradingview.com(log scale))
Funnymentals
Tilly’s main objective is to ride the wave, all the way to the top of the Solana ecosystem. STOCK INVESTOR reviewed the project one month ago.
(Sources: https://tillythekillerwhale.com/)
How Will Tilly The Killer Whale Trade?
Tilly The Killer Whale (Raydium: TILLYUSD) daily chart by Tradingview.
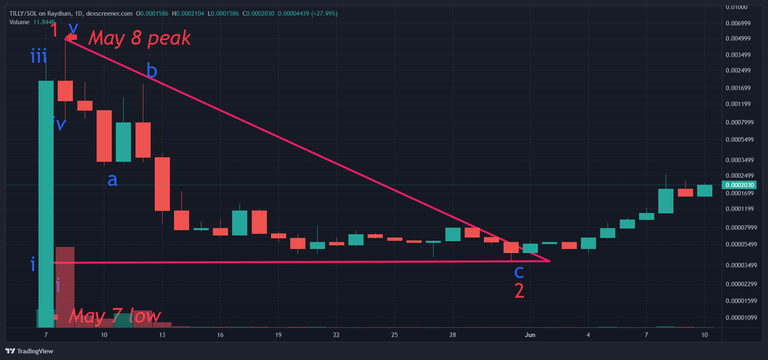
(Chart courtesy of Tradingview.com(log scale))
Prizes
I will be giving upvotes to the correct answers (posts only).
Rules
This poll will expire in one week. Only one vote per person.
Which one will happen first?
Please select one of the three choices and comment below
TILLY will takeout the May 8 peak
TILLY will drop below the May 7 low
TILLY will stay in a trading range between the May 7 low and the May 8 peak until July 16
TILLY will stay in a trading range between the May 7 low and the May 8 peak until July 16
Correct. Upvoted your post:
https://blurt.blog/photography/@ace108/7nkwzm-dinner-at-uncle-leong-seafood-video-or-by-ace108
Thanks
You are welcome.
TILLY will drop below the May 7 low