Hello my blurt academy friends.
I hope we are doing great today ?
Thank you prof @venom-21 for the well detailed lesson on trading charts. Today I will answering questions based on the lecture I received so here we go .
1.) Explain what a trading chart is ?.

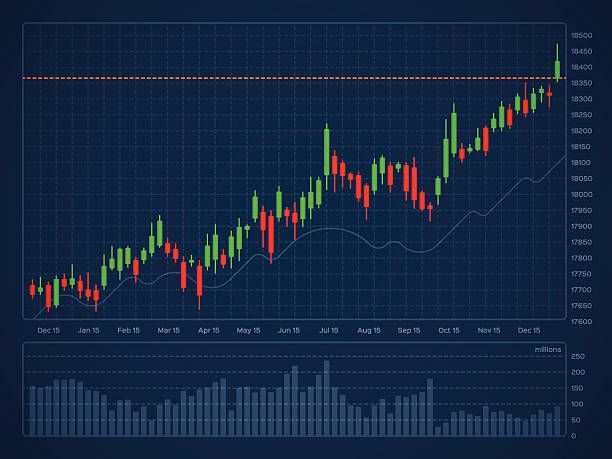
A trading chart can be defined as a chart that displays important information about the price of an asset over a period of time, the trading chart helps the traders with graphical representation that are easily understood to decide when to enter and exit and assets.
The trading chart is made up of the horizontal axis (x axis) and the vertical axis (y axis)). The y axis represent the price of an asset while the x axis represent the time scale of the particular asset. It is important to know that the asset price movement flows from the left to the right which means any new update about the price of an asset keeps moving to the right regardless of if the price is increasing or decreasing.
2.) Briefly Explain the candlestick chart without leaving out the key points. (screenshots required)
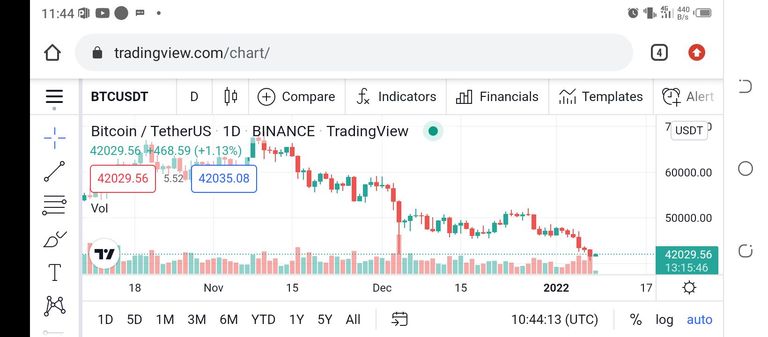
Candlestick chart are also known as the Japanese candlestick chart because it was originated from Japan during the 1700 period. The candlestick chart was created by homma munetisa who was popularly known as a rice trader in Japan, he discovered there was a connection between the price and the demand and supply of rice, it was also discovered that the market was affected by the emotions of traders.
The price movements are interpreted by different colors (red and green), traders make important decisions on the provided patterns which help them to forecast the direction of the price movement for future purpose.
In order words, candlestick charts are used to decide the future market of the price movement based on the past action of a particular asset over a period of time.
Candlestick has two categories which are the bearish and bullish.
Bearish: it means when a particular asset is going to experience a downward trend during period like this traders sell of their assets to avoid loss. Red candlestick represent bearish.
Bullish: it means when a particular asset is going to experience an upward trend, this period will enable traders to buy more assets or stock to acquire profit in the Future. Green candlestick represent bullish.
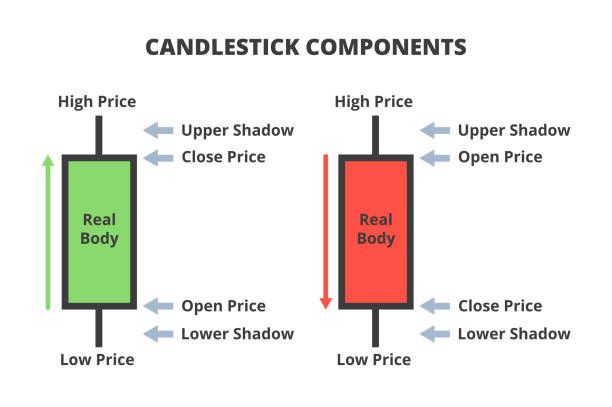
There are prices attached to the candlestick everyone needs to know and identify.
Open price: it simply means the opening price at which a stock started trading.
Close price: it simply means the closing price of a stock, meaning the last sales of a particular stock.
High price: it simply means the highest price a stock was sold or traded at a particular period of time .
Low price: it simply means the Lowest price a stock was sold or traded at a partocy period of time
3.) Explain the major use and importance of a trading chart.
The major use and importance of trading chart is the ability to provide relevant and useful information to traders about assets, it shows the trader the entry and exit point, clear information to know if the asset is appreciating or depreciating in value, alert traders about the open, close, high and low price of a particular asset. This data will make the trade take a profitable trading decision.
4.) What is technical analysis and fundamental analysis ?
Technical analysis: can be defined as a way of forecasting/predicting the price movement with the help of the past price of an asset, if a trader can successfully gather or examine the past market pattern/actions, there is a chance to accurately predict the future price of an asset.
Fundamental analysis: is based on the outer factor meaning the use of public data is used to calculate the value of an asset. Fundamental analysis use macro economic factors such as revenue, profit margin, earning, return on equity and other external factors to determine the value and future growth of an asset.
5.) Summary.
The trading chart is essential as well as important for the traders to use and make financial decisions on how to trade well. If time is taken to fully understand the ways of the trading chart and analysis, a trader can be successful and make huge profit from the market.
This is the end of my assignment.
Till next time.
Hello @ammyy it's nice that you have done my homework for this week. Below are your grades;
Observation;
• You have attempted all questions and answered them completely. However your homework was lacking in some facts I was expecting.
• Your use of Markdown is not nice enough, you need to develop more on your use of Markdown. Try to vary headers from the other contents.
• You wrote in your own words and images were well sourced. You need to watermark your original screenshots.
• All your efforts are well appreciated. Thanks for doing the homework for the intermediate class.
I'm looking forward to continue grading your homework.
Congratulations, your post has been curated by @r2cornell-curate. Also, find us on Discord
Felicitaciones, su publication ha sido votado por @r2cornell-curate. También, encuéntranos en Discord