
Good day everyone and welcome to my blog.
Today, I will be taking us through my current most preferred trading strategy and it is called divergence trading.

Divergence in trading is referred to when an indicator especially and osscilator or volatility based indicator is producing signal contrary to what the price action is indicating.
Let's say an RSI indicator is producing higher high and at the same time the price action is forming a higher low. When this happens, it indicates that the current trend is weak and prone to a possible reversal.
Now that we have seen what divergence means, let's proceed with the analysis.
I will be showing this strategy using a 1hr time-frame where I will first add my three smooth average indicators of period 21, 50 and 200.
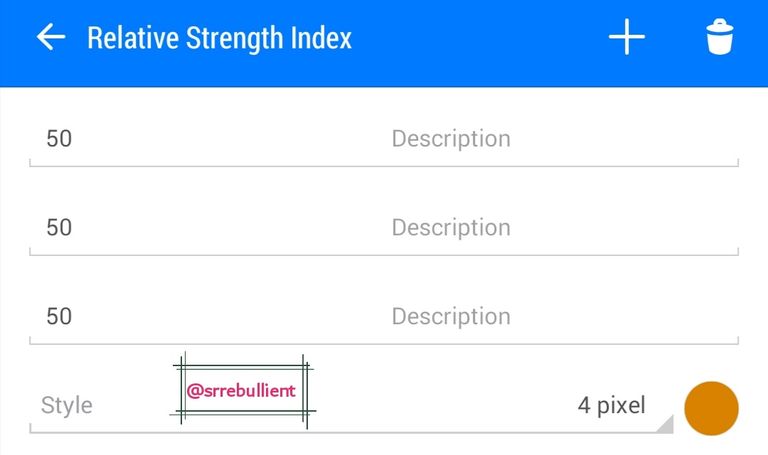
After that, I will add my RSI but here I won't be making use of the overbought and oversold regions so I will go to settings and set all the levels to 50.
- see below
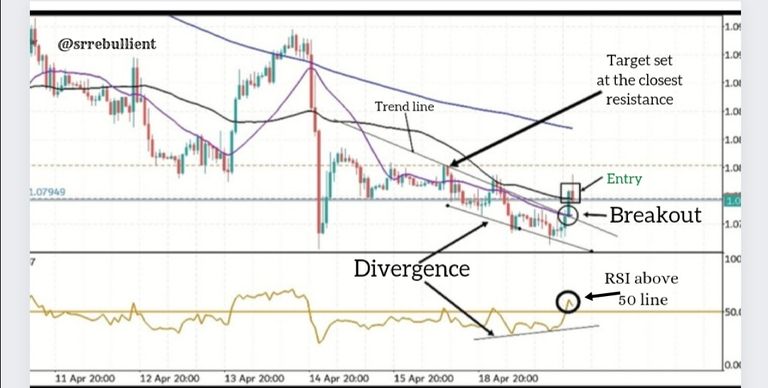
When all indicators are set, I proceed with carrying out my analysis by first spotting a divergence.
If the divergence spotted is a bullish one, I will have to wait for other confluences such as waiting for the RSI to move above the middle line (50) and when that happens, I will have to draw my vertical trend line and wait for a breakout.
Once the breakout happens and the a new candle is formed above the broken resistance, I will make my buy entry.
- See below
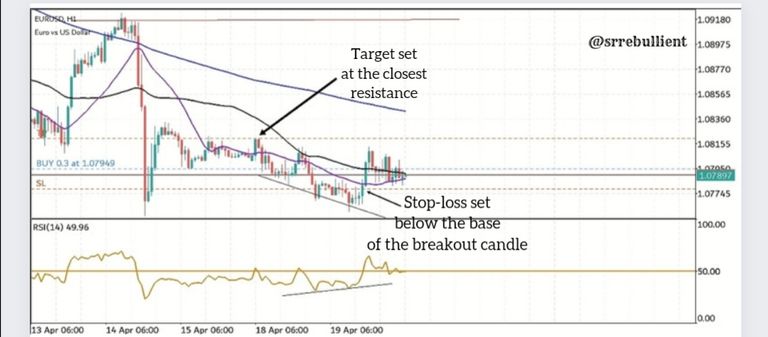
After making an entry, the next thing is to immediately manage risk by setting an exit positions.
My traget will be set just at the closest support while the stop-loss will be set just below the base of the breakout candle.
- See below
After setting my exit, I can now go about my daily activities while I wait for the price to hit my target because it is on a 1 hour time-frame and it is not what I can wait for on the chart. I can only be checking from time to time to know how it is going.
After many hours, I checked and saw that the price have smashed my target.
- See below
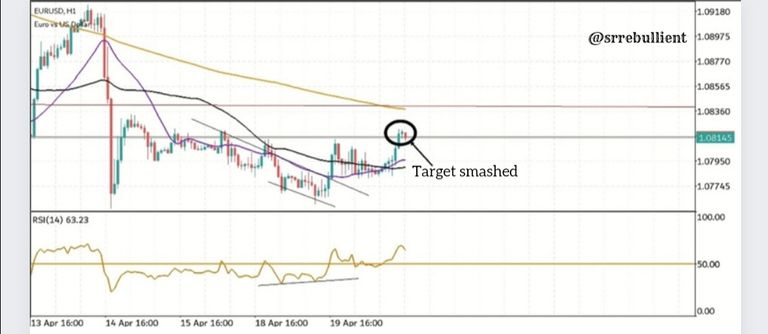
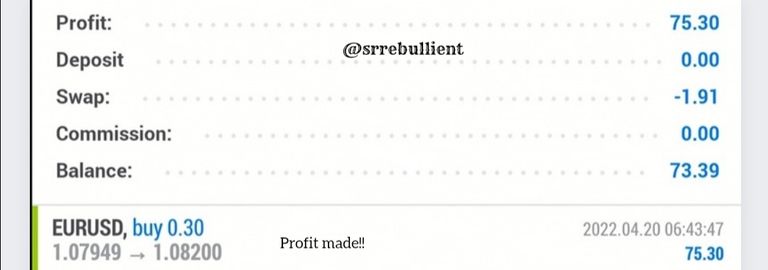
It actually took the trade about 22 hours to hit my target. You can confirm that by calculating the number of candlesticks on the 1hr timeframe.
- See result
CONCLUSION
In conclusion, I will be listing out the number of confluences expected to be confirmed before making an entry in other to avoid fakeouts and these include;
Spot a divergence
Wait for the RSI to move below or above the mid-line depending on the direction of trade.
Draw a vertical trend-line and wait for a breakout.
Wait for the breakout candle to close above the trend-line before making an entry.
Hi, @srrebullient,
Thank you for your contribution to the Blurt ecosystem.
Please consider voting for the witness @symbionts.
Or delegate to @ecosynthesizer to earn a portion of the curation rewards!