For the cryptocurrency space, there are several types of charts that can help traders analyze the market, study the price pattern, reflect on the trend and decide when to enter the market. The sole importance of charts is that they help traders to analyze the price of an asset.
There are several of them when it comes to cryptocurrency price analysis. The Japanese candlestick chart, line chart, point chart are all types of charts that could help in market price analysis.
Japanese Candlestick Chart
This uses an arranged set of candles to show the interactions that occur between the buyers and the sellers in a market. It as well tries to show the opening and closing price of an asset within a specific period of time, and this is dependent on the price mocement. With an upward trend in the price, the closing price will most definitely be higher than the opening price.
A typical candlestick chart of BTCUSD is shown below:
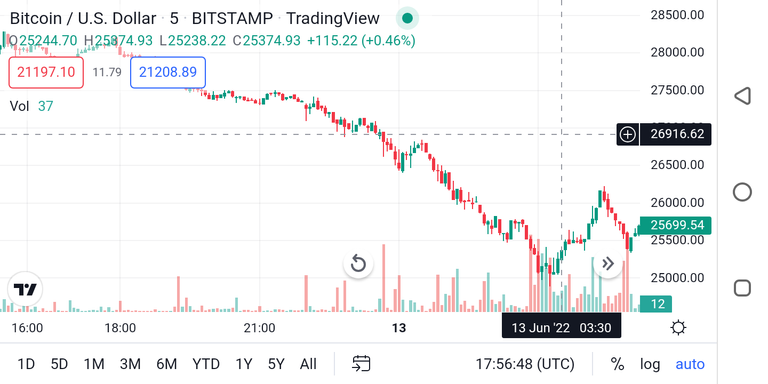
From the chart above, the price movement of the market is in a downtrend and the opening price is higher than the closing price.
Recently, the cryptocurrency space has experienced a huge dip in prices of digital assets which makes it very imperative to make use of these charts in analyzing the market price before making an entry to avoid huge losses. The Japanese candlestick chart is more preferred by majority of traders as well as investors because of the clarity it presents. It allows for the analysis of price at ease, and makes it easier to predict the next possible price action that will follow.
Importance of Charts in trading
Since charts deal with price pattern and movements, a trader who studies Charts will earn an advantaged position in his or her trading activity. Accurate Predictions can be made with a given degree of certainty.
Charts especially the Japanese candlestick chart uses different colors for different pattern. A bullish pattern uses green candlesticks while a bearish pattern makes use of red candlesticks. Hence, price patterns can easily be understood.
Charts help traders to make decisions on the trading position to take; whether long/short, or entry/exit positions.
It's not wise to trade without proper price analysis. Set your Technical indicators active on your charts and study the price pattern as well as the signals from the indicators and trade right. Cheers!