Hola amigos linuxianos de #BLURT,
Tux puede ser un dolor de cabeza, en especial en un servidor Linux, sistema de CPU múltiples o sistema compartido. Sin embargo, existen varias herramientas que ayudan a lidiar con este problema.
Las más conocidas sean tal vez Nagios y SAR, el programa de línea de comandos que muestra información básica sobre los procesos que se ejecutan en el equipo, pero hay tambièn tros programas que proporcionan información en distintos CPU y agregan datos de uso del CPU durante períodos prolongados.
Sin ánimo de ser exhaustivos, les presento una lista de las mejores herramientas para monitorear el rendimiento del CPU en Linux:
Esta es la tercera entrega dedicada a las herramientas más idóneas para monitorear la CPU en Linux y así como lo he hecho con otras guías y tutoriales, debido a su extensión, me he visto obligado a dividirlo en varias partes.
SEPARADOR
Hello #BLURT Linux friends,
Tux can be a headache, especially on a Linux server, multi-CPU system or shared system. However, there are several tools that help deal with this problem.
The best known are perhaps Nagios and SAR, the command line program that displays basic information about the processes running on the computer, but there are also other programs that provide information on different CPUs and aggregate CPU usage data over extended periods.
Without being exhaustive, here is a list of the best tools for monitoring CPU performance on Linux:
This is the third installment dedicated to the most suitable tools for monitoring CPU on Linux and just as I have done with other guides and tutorials, due to its length, I have been forced to divide it into several parts.
11. Netstat.
El comando Netstat muestra información relacionada con varias redes, tales como conexiones de red, tablas de encaminamiento, estadísticas de la interfaz, conexiones de disfraces, membresías multicast, etc .
La información que resulta del uso del comando incluye el protocolo en uso, las tablas de ruteo, las estadísticas de las interfaces y el estado de la conexión. Existen, además de la versión para línea de comandos, herramientas con interfaz gráfica (GUI) en casi todos los sistemas operativos desarrollados por terceros.
Los siguientes son algunos ejemplos de comandos netstat.
Listar todos los puertos (tanto escuchar y no escuchar) utilizando netstat-a, como se muestra a continuación.
netstat -a | more
Active Internet connections (servers and established)
Proto Recv-Q Send-Q Local Address Foreign Address State
tcp 0 0 localhost:30037 : LISTEN
udp 0 0 *:bootpc :
Active UNIX domain sockets (servers and established)
Proto RefCnt Flags Type State I-Node Path
unix 2 [ ACC ] STREAM LISTENING 6135 /tmp/.X11-unix/X0
unix 2 [ ACC ] STREAM LISTENING 5140 /var/run/acpid.socket
Utilice el comando siguiente netstat para averiguar en qué puerto se está ejecutando un programa.
netstat -ap | grep ssh
(Not all processes could be identified, non-owned process info
will not be shown, you would have to be root to see it all.)
tcp 1 0 dev-db:ssh 101.174.100.22:39213 CLOSE_WAIT -
tcp 1 0 dev-db:ssh 101.174.100.22:57643 CLOSE_WAIT -
Utilice el siguiente comando netstat para averiguar qué proceso está utilizando un puerto en particular.
netstat -an | grep ':80'
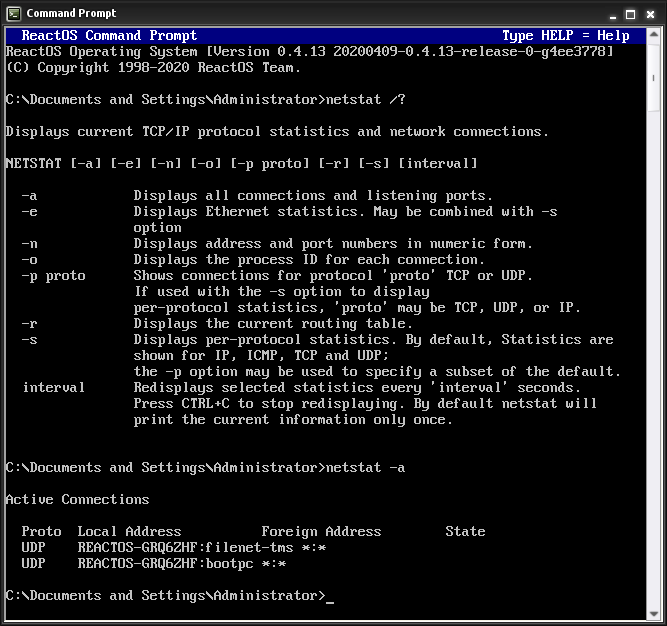
The Netstat command displays information related to various networks, such as network connections, routing tables, interface statistics, disguise connections, multicast memberships, etc .
The information resulting from the use of the command includes the protocol in use, routing tables, interface statistics and connection status. In addition to the command line version, GUI tools are available on almost all operating systems developed by third parties.
The following are some examples of netstat commands.
List all ports (both listening and non-listening) using netstat-a, as shown below.
netstat -a | more
Active Internet connections (servers and established)
Proto Recv-Q Send-Q Local Address Foreign Address State
tcp 0 0 localhost:30037 : LISTEN
udp 0 0 0 *:bootpc :
Active UNIX domain sockets (servers and established)
Proto RefCnt Flags Type State I-Node Path
unix 2 [ ACC ] STREAM LISTENING 6135 /tmp/.X11-unix/X0
unix 2 [ ACC ] STREAM LISTENING 5140 /var/run/acpid.socket
Use the following netstat command to find out on which port a program is running.
netstat -ap | grep ssh
(Not all processes could be identified, non-owned process info
will not be shown, you would have to be root to see it all.)
tcp 1 0 dev-db:ssh 101.174.100.22:39213 CLOSE_WAIT -
tcp 1 0 dev-db:ssh 101.174.100.22:57643 CLOSE_WAIT -
Use the following netstat command to find out which process is using a particular port.
netstat -an | grep ':80' ### 12.
12. IPTraf.
IPTraf es un programa informático basado en consola que proporciona estadísticas de red.
Funciona recolectando información de las conexiones TCP, como las estadísticas y la actividad de las interfaces, así como las caídas de tráfico TCP y UDP. Se encuentra disponible en sistemas operativos GNU/Linux.
Además de un menú de opciones a pantalla completa, IPTraf posee las siguientes características:
Monitor de tráfico IP que muestra información del tráfico de la red.
Estadísticas generales de las Interfaces.
Módulo de estadísticas de LAN que descubre hosts y muestra datos sobre su actividad.
Monitor TCP, UDP que muestra la cuenta de los paquetes de red para las conexiones de los puertos de aplicaciones.
Utiliza el "raw socket interface" que lleva el kernel permitiendo ser usado por un amplio rango de "tarjetas de red" .
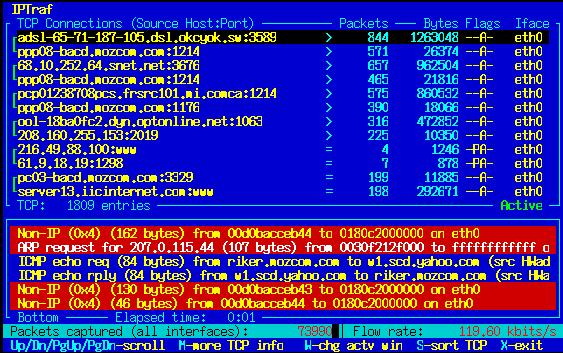
IPTraf is a console-based software program that provides network statistics.
It works by collecting information about TCP connections, such as interface statistics and activity, as well as TCP and UDP traffic drops. It is available on GNU/Linux operating systems.
In addition to a full-screen options menu, IPTraf has the following features:
IP traffic monitor that displays network traffic information.
General Interface Statistics.
LAN statistics module that discovers hosts and displays data about their activity.
TCP, UDP monitor that displays network packet counts for application port connections.
Uses the raw socket interface provided by the kernel allowing it to be used by a wide range of network cards.
13. Strace.
Strace se utiliza para depurar y solucionar problemas de la ejecución de un ejecutable en entorno Linux. Se muestra el sistema de llamadas que utiliza el proceso, y las señales recibidas por el proceso.
Strace controla las llamadas al sistema y las señales de un programa específico. Es útil cuando no se dispone del código fuente y desea depurar la ejecución de un programa. strace le proporciona la secuencia de ejecución de un binario de principio a fin.
Traza llama un sistema específico en un ejecutable usando la opción-e
Por defecto, strace muestra todas las llamadas al sistema para el ejecutable suministrado. El siguiente ejemplo muestra la salida de strace para el comando ls de Linux.
$ strace ls
execve("/bin/ls", ["ls"], [/* 21 vars */]) = 0
brk(0) = 0x8c31000
access("/etc/ld.so.nohwcap", F_OK) = -1 ENOENT (No such file or directory)
mmap2(NULL, 8192, PROT_READ, MAP_PRIVATE|MAP_ANONYMOUS, -1, 0) = 0xb78c7000
access("/etc/ld.so.preload", R_OK) = -1 ENOENT (No such file or directory)
open("/etc/ld.so.cache", O_RDONLY) = 3
fstat64(3, {st_mode=S_IFREG|0644, st_size=65354, ...}) = 0
Para mostrar sólo una llamada al sistema específico, utilice la opción strace-e, como se muestra a continuación.
$ strace -e open ls
open("/etc/ld.so.cache", O_RDONLY) = 3
open("/lib/libselinux.so.1", O_RDONLY) = 3
open("/lib/librt.so.1", O_RDONLY) = 3
open("/lib/libacl.so.1", O_RDONLY) = 3
open("/lib/libc.so.6", O_RDONLY) = 3
open("/lib/libdl.so.2", O_RDONLY) = 3
open("/lib/libpthread.so.0", O_RDONLY) = 3
open("/lib/libattr.so.1", O_RDONLY) = 3
open("/proc/filesystems", O_RDONLY|O_LARGEFILE) = 3
open("/usr/lib/locale/locale-archive", O_RDONLY|O_LARGEFILE) = 3
open(".", O_RDONLY|O_NONBLOCK|O_LARGEFILE|O_DIRECTORY|O_CLOEXEC) = 3
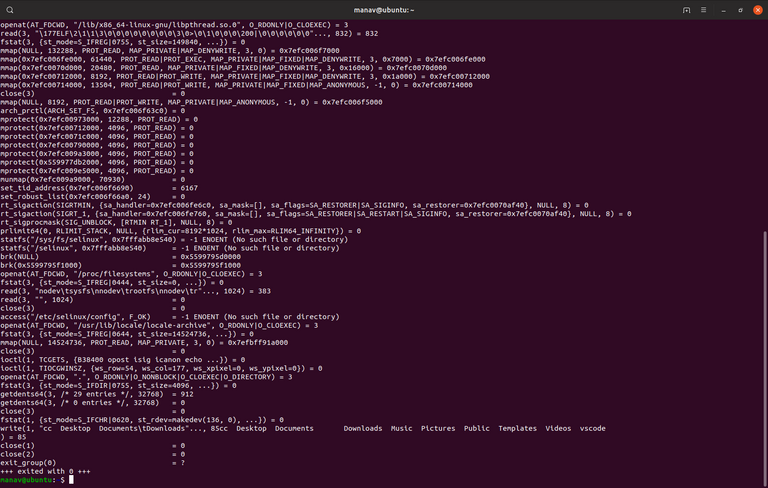
Strace is used to debug and troubleshoot the execution of an executable in Linux environment. It displays the system calls used by the process, and the signals received by the process.
Strace monitors the system calls and signals of a specific program. It is useful when the source code is not available and you want to debug the execution of a program. strace gives you the execution sequence of a binary from start to finish.
Trace calls a specific system in an executable using the e-option.
By default, strace displays all system calls for the supplied executable. The following example shows the output of strace for the Linux ls command.
$ strace ls
execve("/bin/ls", ["ls"], [/* 21 vars */]) = 0
brk(0) = 0x8c31000
access("/etc/ld.so.nohwcap", F_OK) = -1 ENOENT (No such file or directory)
mmap2(NULL, 8192, PROT_READ, MAP_PRIVATE|MAP_ANONYMOUS, -1, 0) = 0xb78c7000
access("/etc/ld.so.preload", R_OK) = -1 ENOENT (No such file or directory)
open("/etc/ld.so.cache", O_RDONLY) = 3
fstat64(3, {st_mode=S_IFREG|0644, st_size=65354, ...}) = 0
To display only a specific system call, use the strace-e option, as shown below.
$ strace -e open ls
open("/etc/ld.so.cache", O_RDONLY) = 3
open("/lib/libselinux.so.1", O_RDONLY) = 3
open("/lib/lib/librt.so.1", O_RDONLY) = 3
open("/lib/lib/libacl.so.1", O_RDONLY) = 3
open("/lib/libc.so.6", O_RDONLY) = 3
open("/lib/libdl.so.2", O_RDONLY) = 3
open("/lib/libpthread.so.0", O_RDONLY) = 3
open("/lib/libpthread.so.1", O_RDONLY) = 3
open("/proc/filesystems", O_RDONLY|O_LARGEFILE) = 3
open("/usr/lib/locale/locale-archive", O_RDONLY|O_LARGEFILE) = 3
open(".", O_RDONLY|O_NONBLOCK|O_LARGEFILE|O_DIRECTORY|O_CLOEXEC) = 3
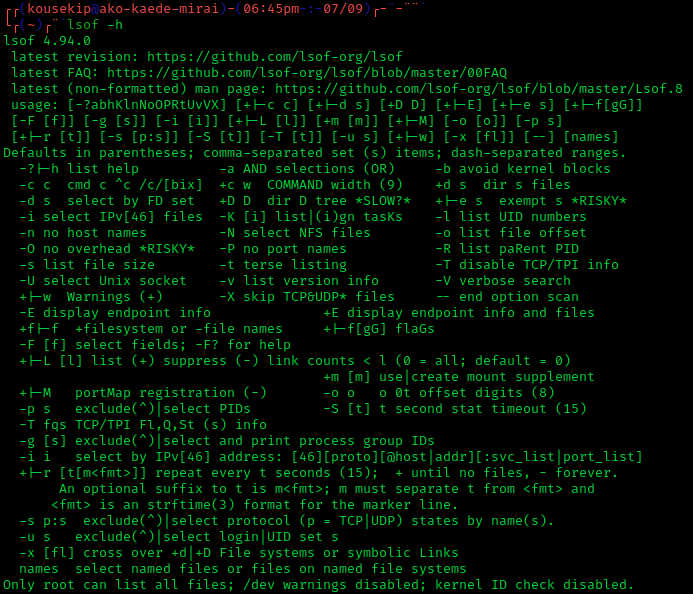
14. lsof.
Lsof es sinónimo de ls archivos abiertos, en el que figurarán todos los archivos abiertos en el sistema. Los archivos abiertos incluyen la conexión de red, dispositivos y directorios.
lsof es software libre y su autor original es Victor A. Abell.
La salida del comando lsof tendrá las siguientes columnas:
COMMAND nombre del proceso.
PID proceso de identificación
USER Nombre de usuario
FD descriptor de fichero
TYPE tipo de nodo del archivo
DEVICE número de dispositivo
SIZE El tamaño del archivo
NODE Número de nodo
NAME Ruta completa del nombre del archivo.
Para ver todos los archivos abiertos del sistema, ejecute el comando lsof sin ningún parámetro, como se muestra a continuación.
lsof | more
COMMAND PID USER FD TYPE DEVICE SIZE NODE NAME
init 1 root cwd DIR 8,1 4096 2 /
init 1 root rtd DIR 8,1 4096 2 /
init 1 root txt REG 8,1 32684 983101 /sbin/init
init 1 root mem REG 8,1 106397 166798 /lib/ld-2.3.4.so
init 1 root mem REG 8,1 1454802 166799 /lib/tls/libc-2.3.4.so
init 1 root mem REG 8,1 53736 163964 /lib/libsepol.so.1
init 1 root mem REG 8,1 56328 166811 /lib/libselinux.so.1
init 1 root 10u FIFO 0,13 972 /dev/initctl
migration 2 root cwd DIR 8,1 4096 2 /
skipped..
Para ver los archivos abiertos por un usuario específico, utilice lsof-u opción para mostrar todos los archivos abiertos por un usuario específico.
lsof -u ramesh
vi 7190 ramesh txt REG 8,1 474608 475196 /bin/vi
sshd 7163 ramesh 3u IPv6 15088263 TCP dev-db:ssh->abc-12-12-12-12.
Para una lista de usuarios de un determinado archivo, utilice lsof como se muestra a continuación. En este ejemplo, se muestra todos los usuarios que actualmente están usando vi.
lsof /bin/vi
COMMAND PID USER FD TYPE DEVICE SIZE NODE NAME
vi 7258 root txt REG 8,1 474608 475196 /bin/vi
vi 7300 ramesh txt REG 8,1 474608 475196 /bin/vi
Lsof is a synonym for ls open files, which will list all open files on the system. Open files include network connection, devices and directories.
lsof is free software and its original author is Victor A. Abell.
The output of the lsof command will have the following columns:
COMMAND process name.
PID process ID
USER user name
FD file descriptor
TYPE file node type
DEVICE device number
SIZE The size of the file
NODE Node number
NAME Full path of the file name.
To view all open files on the system, run the lsof command without any parameters, as shown below.lsof | more
COMMAND PID USER FD TYPE DEVICE SIZE NODE NAME
init 1 root cwd DIR 8,1 4096 2 /
init 1 root rtd DIR 8,1 4096 2 /
init 1 root txt REG 8,1 32684 983101 /sbin/init
init 1 root mem REG 8,1 106397 166798 /lib/ld-2.3.4.so
init 1 root mem REG 8,1 1454802 166799 /lib/tls/libc-2.3.4.so
init 1 root mem REG 8,1 53736 163964 /lib/libsepol.so.1
init 1 root mem REG 8,1 56328 166811 /lib/libselinux.so.1
init 1 root 10u FIFO 0,13 972 /dev/initctl
migration 2 root cwd DIR 8,1 4096 2 /
skipped...
To see the files opened by a specific user, use lsof-u option to show all files opened by a specific user.
lsof -u ramesh
vi 7190 ramesh txt REG 8,1 474608 475196 /bin/vi
sshd 7163 ramesh 3u IPv6 15088263 TCP dev-db:ssh->abc-12-12-12-12-12.
For a list of users for a given file, use lsof as shown below. In this example, it shows all users currently using vi.lsof /bin/vi
COMMAND PID USER FD TYPE DEVICE SIZE NODE NAME
vi 7258 root txt REG 8,1 474608 475196 /bin/vi
vi 7300 ramesh txt REG 8,1 474608 475196 /bin/vi
15. Ntop.
Ntop es una herramienta que permite monitorizar en tiempo real una red. Es útil para controlar los usuarios y aplicaciones que están consumiendo recursos de red en un instante concreto y para ayudarnos a detectar malas configuraciones de algún equipo, (facilitando la tarea ya que. justo al nombre del equipo, aparece sale un banderín amarillo o rojo, dependiendo si es un error leve o grave), o a nivel de servicio.
También se puede acceder desde el navegador de ntop para obtener la información de tráfico y estado de la red.
Las siguientes son algunas de las características clave de los ntop:
Es un proyecto de software libre.
Su interfaz muy sencilla y via web.
Dispone de gran variedad de informes: globales de carga de red, de tráfico entre elementos, de sesiones activas de cada elemento, etc.
Es un software multiplataforma (Windows, Linux, BSD, Solaris y MacOSX) y muy fácil y rápido de instalar.
Para capturar los paquetes, la interfaz de red de la máquina que ejecute NTOP debe entrar en modo promiscuo, lo que implica que hay que disponer de permisos de administrador en dicha máquina.
NTOP usa por defecto el puerto 3000/TCP para el servidor web de la interfaz.
En Linux, NTOP está presente en las principales distribuciones y es fácilmente instalable desde el gestor de paquetes de software de la distribución.
Analiza protocolos TCP/UDP/ICMP.
Dentro de TCP/UDP es capaz de agruparlos por tipo de servicio que se este utilizando como FTP, HTTP, SSH, DNS, Telnet,SMTP/POP/IMAP, SNMP, NFS, X11.

Ntop is a tool that allows you to monitor a network in real time. It is useful to control the users and applications that are consuming network resources in a concrete instant and to help us to detect bad configurations of some equipment, (facilitating the task since. right to the name of the equipment, a yellow or red flag appears, depending if it is a slight or serious error), or at service level.
It can also be accessed from the ntop browser to obtain traffic and network status information.
The following are some of the key features of ntop:
It is a free software project.
It has a very simple interface via web.
It has a great variety of reports: global network load, traffic between elements, active sessions of each element, etc.
It is a multiplatform software (Windows, Linux, BSD, Solaris and MacOSX) and very easy and fast to install.
To capture packets, the network interface of the machine running NTOP must enter promiscuous mode, which implies that you must have administrator permissions on that machine.
NTOP uses by default port 3000/TCP for the interface's web server.
In Linux, NTOP is present in all major distributions and is easily installable from the distribution's software package manager.
It analyzes TCP/UDP/ICMP protocols.
Within TCP/UDP it is able to group them by type of service being used such as FTP, HTTP, SSH, DNS, Telnet, SMTP/POP/IMAP, SNMP, NFS, X11.
- Este tema ha sido tratado en los blogs que enuncio al final del post, reproduciéndolo en forma parcial y/o total. Todos los blogs que se enumeran son de mi propiedad.
- This topic has been discussed in the blogs that I list at the end of the post, reproducing it in part and/or in full. All blogs listed are owned by me.
Capturas de pantallas / Screenshots:
IPTraf: http://iptraf.seul.org/
lsof: https://lsof.readthedocs.io/en/latest/
ntop: https://www.ntop.org/
| Blogs, Sitios Web y Redes Sociales / Blogs, Webs & Social Networks | Plataformas de Contenidos/ Contents Platforms |
|---|---|
| Mi Blog / My Blog | Los Apuntes de Tux |
| Mi Blog / My Blog | El Mundo de Ubuntu |
| Mi Blog / My Blog | Nel Regno di Linux |
| Mi Blog / My Blog | Linuxlandit & The Conqueror Worm |
| Mi Blog / My Blog | Pianeta Ubuntu |
| Mi Blog / My Blog | Re Ubuntu |
| Mi Blog / My Blog | Nel Regno di Ubuntu |
| Red Social Twitter / Twitter Social Network | @hugorep |

| Blurt Official | Blurt.one | BeBlurt | Blurt Buzz |
|---|---|---|---|
 |  |  |  |

 |  |  |  |
|---|