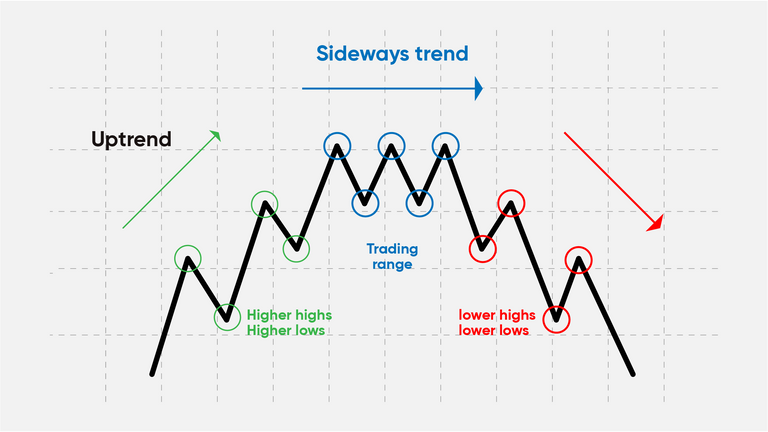
The Dow Jones Theory, also known as Dow Theory, is a financial theory that suggests the market is in an upward trend if one of its averages, such as the Dow Jones Industrial or Transportation averages, advances above a previous important high and is accompanied or followed by a similar advance. The theory is based on the notion that the market discounts everything, meaning that all available information is reflected in the price of stocks. It was developed by Charles H. Dow and is considered one of the earliest forms of technical analysis.
The Dow Jones Theory is based on the idea of identifying trends and confirming them through the use of market averages. It emphasizes the importance of technical analysis, which involves tracking chart patterns to discern price and volume trends, evaluate investments, and identify trading opportunities. Technical analysis seeks to predict price movements by examining historical data, mainly price and volume.
The psychology behind the Accumulation and Distribution phases of the market is based on the idea that market participants, such as investors and traders, tend to behave differently during different phases of the market cycle. During the Accumulation phase, smart money investors are accumulating stocks in anticipation of an upward trend. These investors are typically more sophisticated and have a longer-term perspective. During the Distribution phase, these same investors are distributing their stocks to the public in anticipation of a downward trend.
The Dow Jones Theory identifies three phases of the market: the accumulation phase, the public participation phase, and the distribution phase. The accumulation phase is characterized by a relatively low volume of trading and a narrow range of price movement. The public participation phase is characterized by a significant increase in volume and a wider range of price movement. The distribution phase is characterized by a decrease in volume and a narrowing of the price range.
The Volume indicator is an important tool in technical analysis that can confirm a trend. Volume refers to the number of shares or contracts traded during a specific period of time. When the volume increases during a price move, it indicates that the trend is strong and likely to continue. Conversely, when the volume decreases during a price move, it indicates that the trend is weakening and may be about to reverse.
In summary, the Dow Jones Theory is an important concept in technical analysis that emphasizes the importance of identifying trends and confirming them through the use of market averages. The theory is based on the idea that the market discounts everything and that trends can be identified through the use of technical analysis. The Volume indicator is an important tool in technical analysis that can confirm a trend by indicating the strength of the trend based on the volume of trading.

Upvoted. Thank You for sending some of your rewards to @null. Get more BLURT:
@ mariuszkarowski/how-to-get-automatic-upvote-from-my-accounts@ blurtbooster/blurt-booster-introduction-rules-and-guidelines-1699999662965@ nalexadre/blurt-nexus-creating-an-affiliate-account-1700008765859@ kryptodenno - win BLURT POWER delegationNote: This bot will not vote on AI-generated content