It's Crazy How Accurate this Chart Is
Developed in 1875 By a Farmer Based on Solar Cycles
This 150-Year-Old Chart Says It’s Time To Buy Stocks
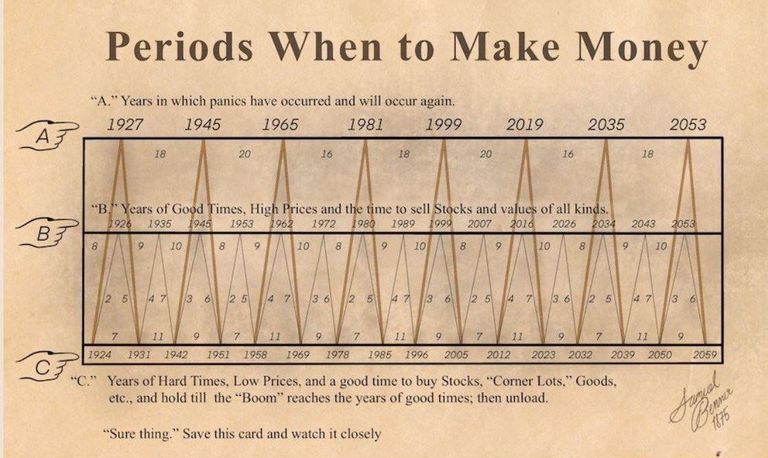
Benner unveiled his magic formula in a book way back in 1875.
The cycle he identified moves based on three time sequences: prosperity in a 16-18-20-year pattern, commodity price lows in an 8-9-10-year pattern, and recessions in a 5-6-7-year one. To be clear, a 16-18-20 pattern means that you should expect 16 years between the first two prosperous periods, 18 years between the next two, and 20 years between the following two. After that, it goes back to 16 years between them.
Back in the 19th century, an under-the-radar thinker may have discovered the secret patterns behind asset prices, a rhythmic dance of booms followed by busts and panic. But this wasn’t the discovery of a trading whizz or a mathematician: Samuel Benner was a humble pig farmer.
Source: https://finimize.com/content/this-150-year-old-chart-says-its-time-to-buy-stocks#
Upvoted. Thank You for sending some of your rewards to @null. Get more BLURT:
@ mariuszkarowski/how-to-get-automatic-upvote-from-my-accounts@ blurtbooster/blurt-booster-introduction-rules-and-guidelines-1699999662965@ nalexadre/blurt-nexus-creating-an-affiliate-account-1700008765859@ kryptodenno - win BLURT POWER delegationNote: This bot will not vote on AI-generated content