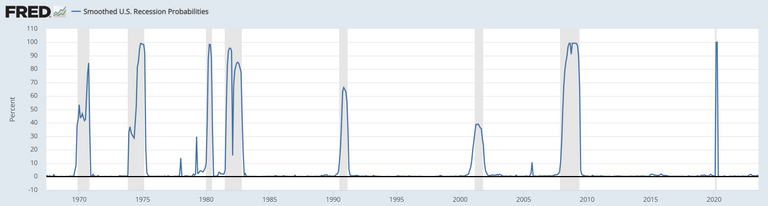
The chart above provides a month-to-month representation of the estimated likelihood that the U.S. economy is currently experiencing a recession.
These probability estimates are derived from a set of economic indicators discussed in this article. The FRED chart also helpfully marks periods when real recessions occurred, as determined by the NBER business cycle dating committee.
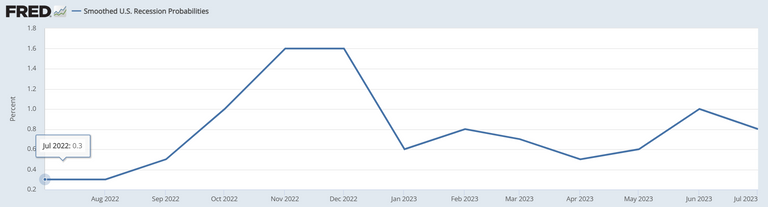
You have the freedom to form your own assessment regarding whether we are presently in a recession or not. As of the time of this publication, the data for July 2022 does not appear to indicate a recession.
It's important to keep in mind that economic data can lag behind current events, and economic conditions can change swiftly. Furthermore, our current economic situation differs from previous ones. Consequently, while we cannot dismiss the possibility that the model might not be entirely accurate this time, we can certainly consider our own judgment regarding the likelihood of that being the case.
About Smoothed U.S. Recession Probabilities
The United States' smoothed recession likelihoods are derived from a dynamic-factor Markov-switching framework, which is employed on four monthly concurrent indicators.
These indicators include
- Non-farm payroll employment
- The industrial production index
- Real personal income (excluding transfer payments)
- Real sales in manufacturing and trade
The foundation of this model can be traced back to Chauvet, M.'s work titled "An Economic Characterization of Business Cycle Dynamics with Factor Structure and Regime Switching," published in the International Economic Review in 1998 (Volume 39, Pages 969-996).