RSI is a momentum oscillator designed to measure the speed and change of price movements.
Its purpose is to assess the relative value of a stock, index, or other investment based on its recent price history.
RSI in the Context of Investment
Effective investment begins with a long-term plan tailored to individual goals, risk tolerance, time horizon, liquidity requirements, and tax considerations.
Fundamental analysis should be the foundation of investment choices.
Alongside fundamental analysis, technical analysis plays a complementary role, helping to identify entry and exit points for a stock, detect emerging changes not yet reflected in fundamental estimates, and provide a reality check on fundamental expectations for a stock, an industry, or the broader market.
How RSI Works
RSI is a momentum oscillator, fluctuating between 0 and 100. Its primary use is to determine whether an investment is overbought or oversold, calculated based on the average gain and average loss over a defined period.
RSI is most valuable in non-trending markets, where trends are not clearly upward or downward.
Interpreting RSI Levels
Investors typically adhere to straightforward rules when using RSI.
RSI levels below 30 (the red line) indicate oversold conditions, signaling a potential buy opportunity.
Conversely, RSI levels above 70 (the green line) indicate overbought conditions, signaling a potential sell opportunity.
Customizing RSI
Some users adjust RSI rules to suit their preferences and analysis.
Instead of the standard 30 and 70 as oversold and overbought levels, a common modification widens these parameters to 20 and 80.
Under this scheme, an RSI drop to 20 generates a buy signal, while an RSI rise to 80 generates a sell signal.
Validating RSI Signals
RSI signals are considered most reliable when values reach extremes near the upper or lower boundaries.
An RSI reading near 100 implies overbought conditions (a sell signal), while an RSI reading near 0 suggests oversold conditions (a buy signal). Signals are also more credible when RSI stays above 70 or below 30 for an extended period.
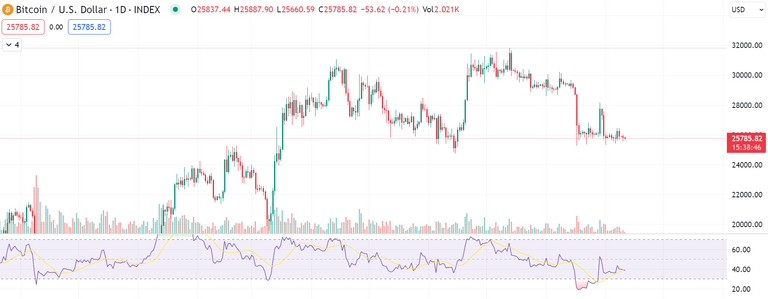
What RSI Indicates About BTC
Looking at the BTC chart, BTC has generally trended higher throughout the year but have stagnated since mid-April, recently down to 25,300.
RSI has been under 30 since mid-August, indicating that BTC are oversold.
Recently, RSI jumped higher with Grayscale material, but still BTC is in the trend getting deeper in oversold zone.
It's important to note that this doesn't guarantee decreasing or increasing BTC.
Additional Applications of RSI
RSI can stay in overbought or oversold territory for extended periods, potentially lasting weeks or months.
Besides overbought and oversold signals, RSI can provide deeper insights into its relationship with stock or index price action.
A positive RSI reversal, where RSI forms a lower low while prices make a higher low, generates a buy signal.
Conversely, a negative reversal, where RSI forms a higher high while prices make a lower high, generates a sell signal.
It's crucial to emphasize that RSI should not be the sole basis for trading decisions.
Most technical analysts use RSI in conjunction with other technical indicators, fundamental analysis, and business cycle analysis.
Reference: Fidelity