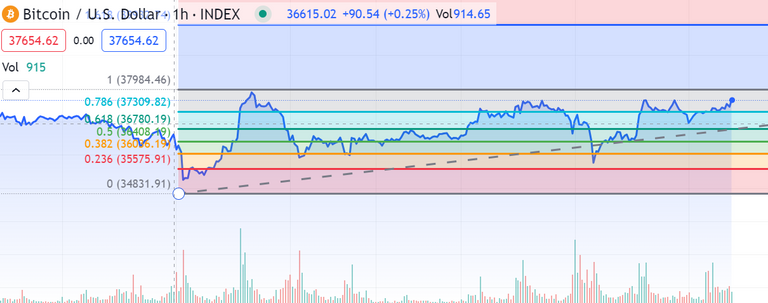
Fibonacci retracement is a technical analysis tool used in trading, including in the cryptocurrency and stock markets. It is based on the Fibonacci sequence, a series of numbers in which each number is the sum of the two preceding ones.
The sequence starts 0, 1, 1, 2, 3, 5, 8, 13, 21 and so on.

Concept
Fibonacci retracement is used to identify potential levels of support and resistance on a price chart. The key ratios derived from the Fibonacci sequence, such as 38.2%, 50%, and 61.8%, are commonly used in this analysis.
Basic Rule
- Identify a Trend: First, identify a significant price movement, either upward (uptrend) or downward (downtrend).
- Select Swing Points: Choose two extreme points on the chart, usually the highest high and the lowest low during the identified trend.
- Plot Fibonacci Levels: Apply the Fibonacci retracement tool to the selected points. This will generate horizontal lines representing key Fibonacci levels – 38.2%, 50%, and 61.8%. Traders also often use 23.6% and 78.6%.
Application
- Support and Resistance: Traders use Fibonacci levels as potential support and resistance levels. If the price retraces to a Fibonacci level and bounces, that level is considered a potential support or resistance.
- Market Corrections: Traders use Fibonacci retracement to identify potential levels where a market correction may end, and the original trend could resume.
Accuracy
The effectiveness of Fibonacci retracement depends on various factors, and it is not foolproof. Traders often use Fibonacci levels in conjunction with other technical indicators and analysis tools to increase the accuracy of their predictions.
Fibonacci Extensions
In addition to retracement, Fibonacci extensions are used to identify potential levels where the price could extend beyond the original trend. Common extension levels include 127.2%, 161.8%, and 261.8%.
Fibonacci Retracement Levels
- 23.6% retracement level: This is the most common level for a price to retrace to. It is also known as the "golden ratio."
- 38.2% retracement level: This is another common level for a price to retrace to. It is also known as the "Fibonacci retracement level of 0.382."
- 50% retracement level: This is the midpoint between the high and low points of a price move. It is also known as the "Fibonacci retracement level of 0.5."
- 61.8% retracement level: This is a less common level for a price to retrace to, but it can still be significant. It is also known as the "Fibonacci retracement level of 0.618."
- 100% retracement level: This is the level at which the price retraces the entire move. It is also known as the "full retracement level."
Caution
While Fibonacci retracement is widely used, traders should be cautious and not rely solely on it. Markets can be influenced by various factors, and no analysis tool guarantees accurate predictions.
If the price of an asset is in an uptrend and starts to pull back, a trader might use Fibonacci retracement to identify potential support levels where the price could bounce and continue the uptrend.
Keep in mind that the effectiveness of Fibonacci retracement can vary, and it's important to use it as part of a comprehensive trading strategy. Traders often combine Fibonacci analysis with other technical indicators and fundamental analysis for more robust decision-making