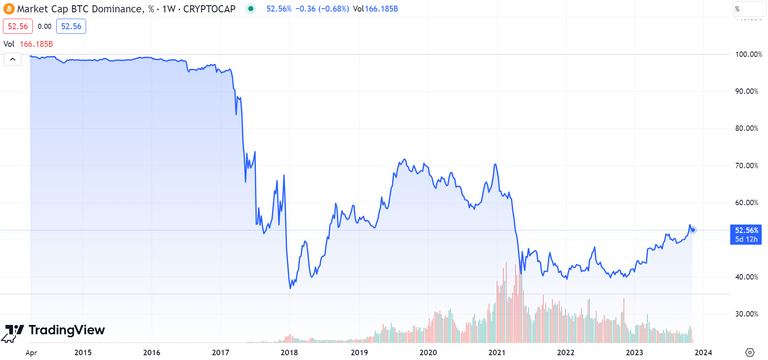
The opinion that altcoins easily bleed into Bitcoin during a bear market and in the pre-halving year is supported by historical data.

For example, in the 2017-2018 bear market, the Bitcoin Dominance Index (BDI), which measures the percentage of the total cryptocurrency market capitalization that is attributed to Bitcoin, increased from around 38% to over 71%. This indicates that investors were selling altcoins and buying Bitcoin during this period. The same trend was also seen in the lead-up to the 2020 Bitcoin halving, when the BDI increased from around 51% to 68%.
There are a number of possible explanations for why altcoins tend to bleed into Bitcoin during bear markets and in the pre-halving year. One possibility is that investors perceive Bitcoin as being a safer investment than altcoins during these periods. Bitcoin is the most well-known and established cryptocurrency, and it has a proven track record of surviving bear markets. Altcoins, on the other hand, are more speculative and riskier investments.
Another possibility is that investors sell altcoins and buy Bitcoin in order to raise cash. This can be necessary if investors need to meet margin calls or if they simply want to reduce their overall risk exposure.
While it is true that investors who had a higher allocation to Bitcoin outperformed investors who had a higher allocation to altcoins in the first half of the 2017-2018 bear market, they underperformed in the second half. This suggests that there is no guarantee that Bitcoin will always outperform altcoins in bear markets.
Overall, the opinion that altcoins easily bleed into Bitcoin during a bear market and in the pre-halving year is supported by historical data. However, it is important to remember that the crypto market is highly volatile and unpredictable, and there is no guarantee that Bitcoin will always outperform altcoins. Investors should carefully consider their own risk tolerance and investment goals before making any decisions about where to allocate their capital.
| Event | Date | BTC dominance change before and after | Price change before and after |
|---|---|---|---|
| First halving | November 2012 | 99% to 95% | $11 to $650 |
| Second halving | July 2016 | 95% to 65% | $650 to $19,000 |
| Third halving | May 2020 | 65% to 55% | $8,800 to $68,000 |
| Current | November 2023 | 55% to 45% | $68,000 to $20,000 |
| Next halving | March 2024 | (Estimated) 45% to 40% | (Estimated) $20,000 to $30,000 |