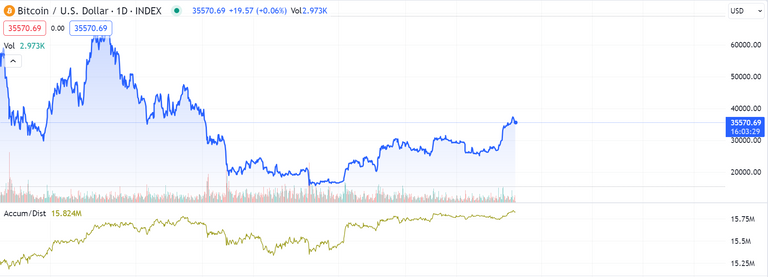
The Accumulation Distribution Line (ADL) is a volume-based technical indicator developed by Marc Chaikin to measure the cumulative flow of money into and out of a security. The ADL was originally called the Cumulative Money Flow Line. As with cumulative indicators, the ADL is a running total of each period's Money Flow Volume (MFV).
It is designed to evaluate the cumulative flow of money into or out of a security by considering both its price and volume. The ADL helps traders and analysts identify potential price trends, confirm the strength of a trend, or spot potential reversals.
Let's see the detailed explanation of the key components and calculations involved in the Accumulation Distribution Line.
Components
Close Location Value (CLV): The CLV is a measure of where the closing price is relative to the range between the high and low prices for a given period.
It is calculated as follows.
CLV = (Close - Low - (High - Close)) / (High - Low)Money Flow Multiplier (MF Multiplier): The MF Multiplier is used to quantify the strength of money flow on a particular day. It is determined by comparing the CLV with the CLV of the previous day.
The formula is:
MF Multiplier = (CLV * Volume) / Average Daily VolumeMoney Flow Volume (MFV): The Money Flow Volume is the final component and is calculated by multiplying the MF Multiplier by the day's volume.
MFV = MF Multiplier * Volume
Calculation of ADL
The ADL is calculated cumulatively over a given period. The starting point is usually the ADL value from the previous period (or zero for the first period).
The ADL for each subsequent period is calculated as follows.
ADL_today = ADL_yesterday + MFV_today
Interpretation
The primary idea behind the ADL is that changes in the indicator may precede changes in the price of a security. A rising ADL suggests that the security is being accumulated, potentially indicating strength in an uptrend. Conversely, a falling ADL may indicate distribution, suggesting weakness in a downtrend.
Traders often look for divergences between the ADL and the price chart, as divergences can signal potential reversals. For example, if the price is rising, but the ADL is falling, it may suggest weakening buying pressure.
It's required that to note that while the ADL can be a useful tool, like any technical indicator, it is not foolproof, and it's often used in conjunction with other indicators and analysis methods. Additionally, different charting platforms and analysts may use variations in the calculation method or parameters.
ADL is not a Perfect Indicator
- Use the ADL in conjunction with other technical indicators to get a more complete picture of the market.
- Be aware of the limitations of the ADL. It is not a foolproof indicator, and it can sometimes give false signals.
- Use the ADL with caution in volatile markets.
A little reminder: I am a top 20 Blurt witness, sooo please help me stay there!
Please consider taking a moment to vote for my witness, if you haven't already done so!
You can do this by logging into your wallet with your active key! 🗳️
It only takes a few seconds and doesn't cost a cent!
https://blurtwallet.com/~witnesses?highlight=outofthematrix