Fibonacci Retracement
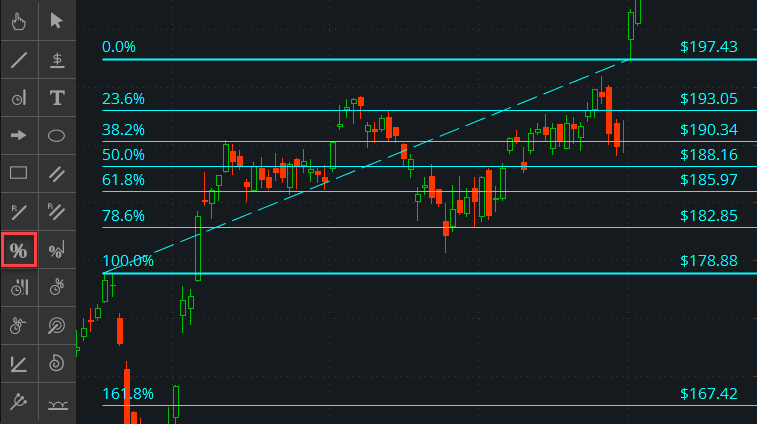
Fibonacci retracement is a technical analysis tool used to identify potential levels of support and resistance for a given asset. It is based on the Fibonacci sequence, a mathematical sequence where each number is the sum of the previous two numbers. In the context of trading, Fibonacci retracement is used to identify the percentage of a price move that has been retraced, and then project potential levels of support and resistance based on those percentages[1][2][3][4][5].
Fibonacci extension, on the other hand, is a technical analysis tool used to identify potential levels of price extension beyond the initial move. It is also based on the Fibonacci sequence, but instead of measuring the percentage of a price move that has been retraced, it measures the percentage of a price move that is expected to extend beyond the initial move. The most commonly used Fibonacci extension levels are 1.618, 2.618, and 4.236, which are calculated based on the Fibonacci sequence[1][2][3][4][5].
Fibonacci extension is used to determine price targets after the prevailing trend has resumed. It is similar to Fibonacci retracements, which are used to determine possible support and resistance levels based on the mathematical relationships between the numbers in the Fibonacci series. However, unlike Fibonacci retracements, Fibonacci extensions seek possible support and resistance levels that are more than 100% of the previous price movement[2].
Fibonacci extensions are used to identify potential levels of price extension beyond the initial move, and they are calculated by performing various mathematical operations on the numbers in the Fibonacci series, and on the results of those operations. The key Fibonacci extension levels are found by dividing a number in the sequence by the number that precedes it, by dividing a number in the sequence by the number that appears two places before it, and by dividing a number in the sequence by the number that appears three places before it. The 161.8%, 261.8%, and 423.6% ratios are the most commonly used Fibonacci extension levels[2].
Fibonacci extensions are used in a similar way as Fibonacci retracements but in the opposite direction. To use Fibonacci extensions, traders must identify the dominant trend, wait for the market to turn against the trend, and then wait for the market to start moving back in the direction of the dominant trend. The extension ratios are then applied to the previous countertrend movement, starting from the previous low to the high in an uptrend and in the opposite direction in a downtrend. Horizontal lines are drawn at these levels and are used as possible resistance levels if the dominant trend is an uptrend, or as possible support levels if the dominant trend is a downtrend. These levels can be used as profit targets when trading in the direction of the dominant trend[2].
In summary, Fibonacci retracement is a technical analysis tool used to identify potential levels of support and resistance based on the percentage of a price move that has been retraced, while Fibonacci extension is a technical analysis tool used to identify potential levels of price extension beyond the initial move based on the percentage of a price move that is expected to extend beyond the initial move. Both are based on the Fibonacci sequence and are used to enhance the trader's ability to identify profitable trading opportunities.