Pivot point is one of the very popular and top technical analysis techniques that has proven to be very beneficial in cryptocurrency trading. Pivot point is one of the many technical indicators that is used for determining and predicting support and resistance levels, price range forecasting, pin-pointing tops and bottoms on a chart..
We all know the importance of technical analysis when it comes to trading any cryptocurrency asset, and the pivot point along with other technical indicators like the MACD, moving average, volume, are great indictors that are very valuable as far as prediction in the market is concerned.
The Pivot Points indicator is simply a technical indicator that makes use of the normal price actions like the highs, lows and close from the day before to generate the base reference points. The pivot point indicator can also be called a leading indicator and it is based on past price actions. Pivot Points indicator plots the support and resistance points away from the main pivot point which is usually labelled as P.
The pivot point indicator being a very popular indicator used in technical analysis and price range forecasting, has a lot of benefits. It can help cryptocurrency traders figure out the best points to enter or exit a trade, and aside from that, it can help traders know where to set stop loss. On the Pivot Points indicator, when support and resistance levels is above the central pivot, then the market is bullish and when the support and resistance levels is below the central pivot, the market is bearish.
Details about Pivot Point Levels
The Support level is simply a term used in technical analysis. On a cryptocurrency price chart, the support level shows the level in which the price of an asset stops after a fall in price and reverses upwards and rises. That price point where the asset bounces off and reverses upwards after a fall in price is known as the support level. Let’s take for example, The price of LTC is moving in a downward direction and then it hits a level at $200 and stops and reverses and rises into an upward direction, the $200 price point is the support level of LTC. As the market continues to move in either direction, new support levels will be created.
The Resistance level is simply a term used in technical analysis. There is nothing more to resistance level that just the exact opposite of support level. If support level is the floor, then resistance level is the roof. That is how I see it. On a cryptocurrency price chart, the resistance level shows the level in which the price of an asset stops after a rise in price and reverses downwards and falls.
That price point where the asset bounces off and reverses downwards after a rise in price is known as the resistance level. Let’s take for example, the price of LTC is moving in an upwards direction and then it hits a level at $350 and stops and reverses and falls into a downward direction, the $350 price point is the resistance level of LTC on the chart. As the market continues to move in either direction, new resistance levels will be created.
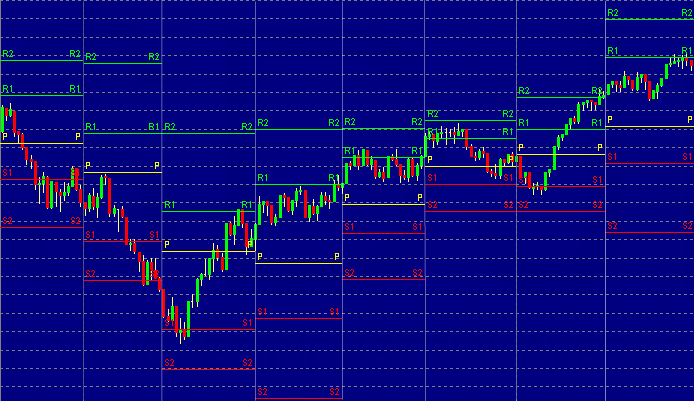
Pivot Point Levels
Center Рivоt Роint or Main Pivot Point is simply the center point on the chart. Using the pivot point indicar, the center pivot or main pivot is usually labelled as P. When support and resistance levels is above the central pivot, then the market is bullish and when the support and resistance levels is below the central pivot, the market is bearish.
S1 is the first support level, it simply the first support level that is above the center pivot P which signals an uptrend movement.
S2 is the second support level, it is simply the second support level that is below the first support level S1.
S3 is the third support level, it is simply the third support level that is below the first support level S1 and second support level S2.
R1 is the first resistance level, it is the first resistance level that is above the center or main pivot point P.
R2 is the second resistance level, it is the second resistance level that is above the first resistance level R1.
R3 is the third resistance level, it is the third resistance level that is above the second resistance level R2 and third resistance level R3.