Hello, dear Blurt community!
This is my very first Technical Analysis (TA) on Blurt. And, I think to start with the price chart of Litecoin.
So, in the monthly time frame (MN), LTC/USD has recorded two very interesting candlestick formations. The first one is a Shooting Star. The second one is a Bearish Engulfing:
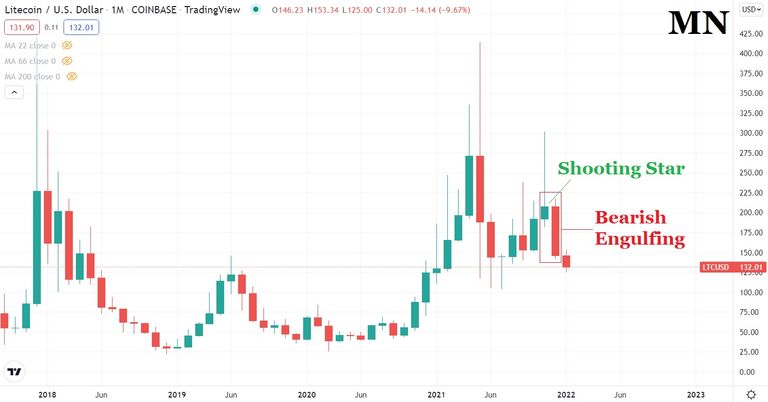
Theoretically, both candlestick formations are viewed as bearish signals and, to be more precise, - potential trend reversal signals. So, this is a signal that the bears are trying to gain control over the market.
However, if we have a look at the weekly chart (1W), let me remind you that there is a Double Bottom that formed during the Bear Market:
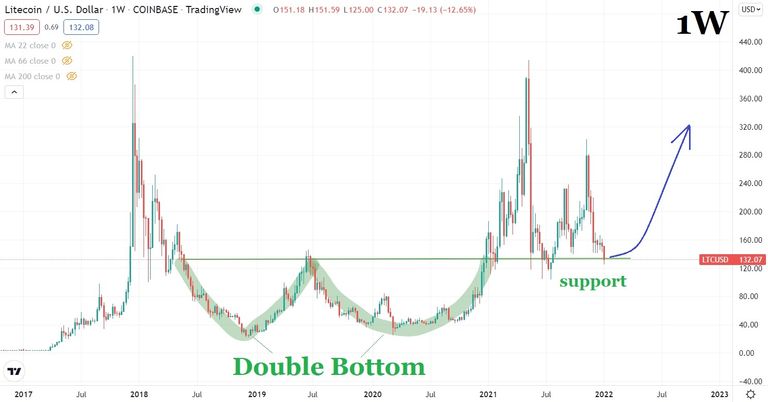
As can be seen from the chart, right now, the price is at the support line. So, this is a critical moment for the price of Litecoin. If it rebounds then the chances of beginning the long-awaited uptrend will increase.
However, for now, the bulls have to be really very careful because, according to the daily chart (1D), a price rebound is still not around the corner. LTC/USD is testing the trend line (uptrend line):
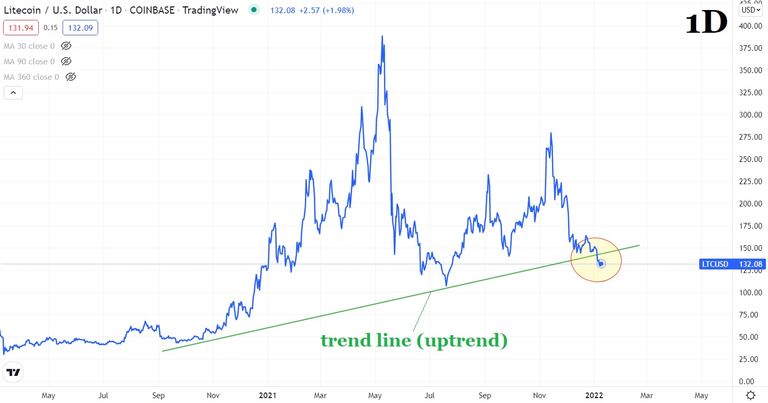
So, in the daily time frame (1D), the price is at a crossroads as well.
To be continued ...
As of the time of writing, one LTC costs $132,08 on the Coinbase crypto exchange, according to TradingView.
A few words about me:
Just to let you know: I've been working professionally as a currency analyst for the last 15 and a half years and as a cryptocurrency analyst for the last 4 and a half years.
Important!
Keep in mind, that the thoughts expressed here are my own, and they should not be regarded as recommendations for any cryptocurrency/commodity trades, investments and etc.