👨🎓Quick lesson 📈👨🎓

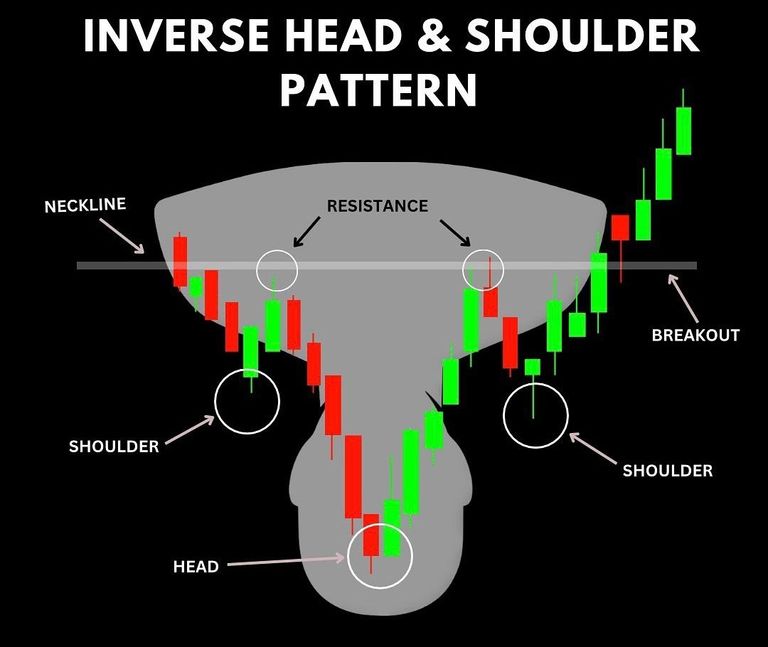
The below chart shows an Inverse Head & Shoulders pattern. It’s a clue that the market might go up after being down.
Left Shoulder, Head, Right Shoulder: Three dips, with the middle one (the head) being the lowest.
Neckline: A resistance line where the price struggles to go higher.
Breakout: When the price finally breaks through that neckline, it’s a signal the market might start rising.
This pattern means: the downtrend might be ending, and it’s time to watch for upward moves. 💪📈
Upvoted. Thank You for sending some of your rewards to @null. Get more BLURT:
@ mariuszkarowski/how-to-get-automatic-upvote-from-my-accounts@ blurtbooster/blurt-booster-introduction-rules-and-guidelines-1699999662965@ nalexadre/blurt-nexus-creating-an-affiliate-account-1700008765859@ kryptodenno - win BLURT POWER delegationNote: This bot will not vote on AI-generated content