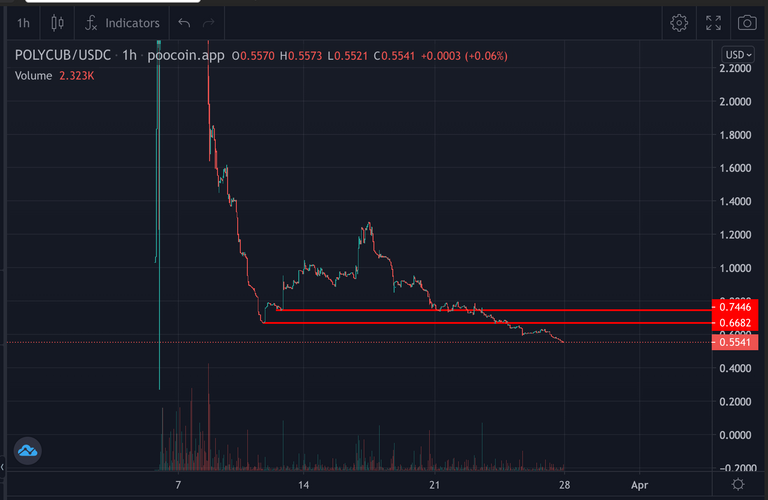
PolyCub price is on all-time low level. It broke down resistances where I shared a few days ago PolyCub Price is on First Support Level After Accumulation..
I didnt expect that polyCub Price might break down easily but It happened...
Price dropping is normal during airdrop. We experienced this with SPS. It is difficult to guess the bottom of price chart...

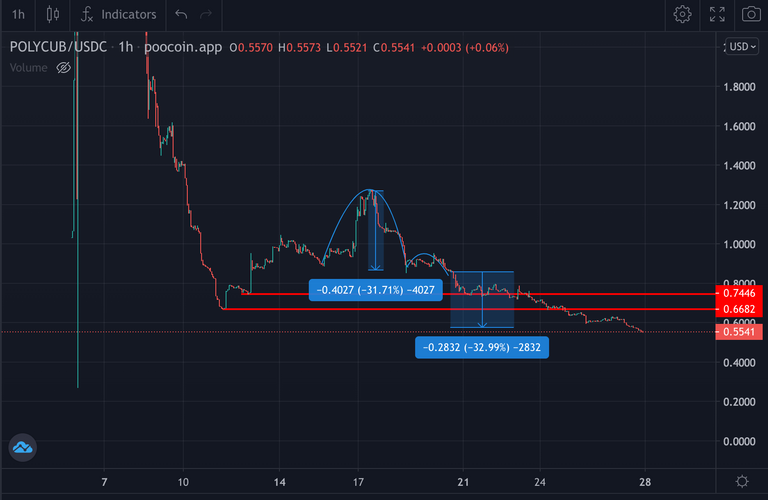
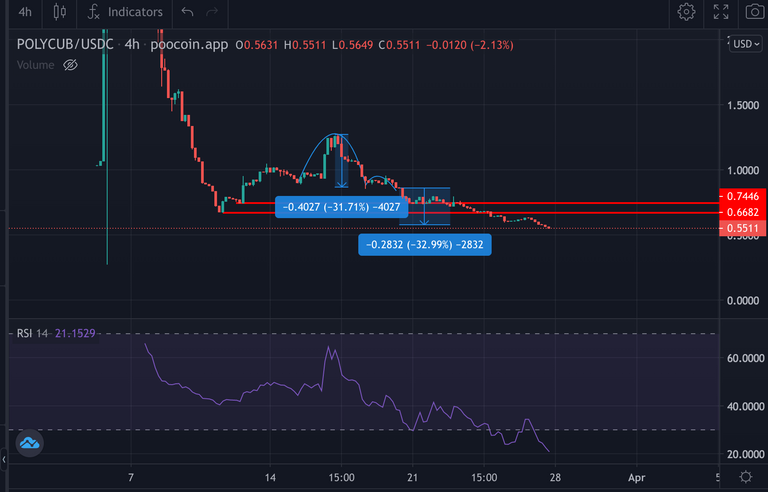
After polycub price broke down support levels, Polycub completed head&shoulders pattern what I shared before..
Now, Polycub price touched the target of pattern! We should see the reaction of price!

We are in mini Spring bullish market. Polycub should be supported by this bullish market but airdrop is selling pressure..
It is on oversold level. You can check RSI Indicator in 1-hour and 4-hour charts... So, It may be an opportunity to take bounce...

Marketcap should be followed during airdrop to find the bottom of price. If Polycub supply reach max, total marketcap will be over 10M USD. It may be high for new DeFi project...

but We should be close to bottom of chart. I am starting to pick up polyCub...