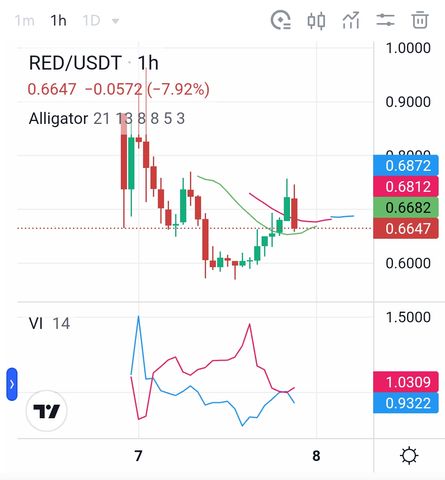
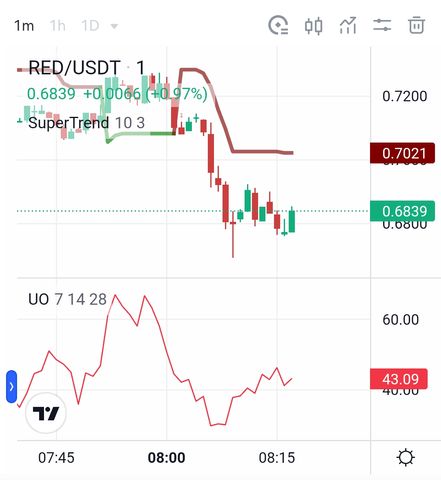
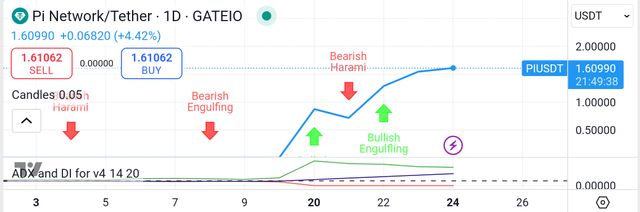
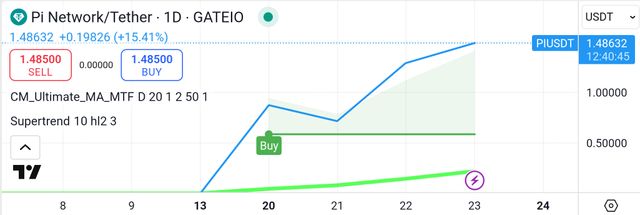
New: indicatorAll contentvideoburnbotkrblurtactifitartgameszzannewsblurtgermanr2cornellphotographylolzaimusicwamblurtblockmemeblurtlifeblurtindiablurthispanoHotTrendingNewDAppspuncakbukit in red • 5 days ago[New Token] 1 RED = $0.664 USDT - How does it offer unparalleled speed compared to traditional oracles?(Chart by Gate.io) RedStone (RED) is charging into the crypto arena, bringing a revolutionary oracle solution that's set to redefine decentralized applications. The Williams Alligator pattern is…puncakbukit in red • 6 days ago[New Token] 1 RED = $0.683 USDT - Is it the dawn of a new era for decentralized data access?(Chart by Gate.io) RedStone (RED) has officially entered the market, marking the dawn of a new era for decentralized data access. This oracle network is not just another token launch; it's the…puncakbukit in pi • 17 days ago[New Coin] 1 PI = $1.609 USDT - What is its innovative mobile mining approach?(Chart by TradingView) TL;DR: Pi is a new cryptocurrency that can be mined on our mobile phones. To join and start mining and earning Pi follow this link and use the invite code…puncakbukit in pi • 18 days ago[New Coin] 1 PI = $1.486 USDT - How does it revolutionize cryptocurrency by democratizing access through its mobile-first mining model?(Chart by TradingView) TL;DR: Pi is a new cryptocurrency that can be mined on our mobile phones. To join and start mining and earning Pi follow this link and use the invite code…puncakbukit in sbd • 20 days ago1 SBD = $0.432 USD - What If the Steem platform itself faces challenges during the bear market?(Chart by TradingView) The emergence of a bearish harami pattern hints at further market declines, potentially creating a precarious situation for even seasoned investors. While some might see…puncakbukit in sbd • 21 days ago1 SBD = $0.636 USD - How does it maintain a floor value near 1 US dollar?(Chart by TradingView) Steem Backed Dollar (SBD) is touted as a half-stablecoin within the Steem ecosystem, theoretically designed to maintain a floor value near 1 US dollar. However, current…puncakbukit in steem • 23 days ago1 STEEM = $0.158 USD - Why does it distribute cryptocurrency to users for their valuable contributions?(Chart by TradingView) Steem is making waves in the crypto world, and for good reason. It's built to reward users for their contributions to the platform, whether it's creating killer content or…puncakbukit in steem • 24 days ago1 STEEM = $0.169 USD - How does it incentivize content creation, curation, and engagement?(Chart by TradingView) The cryptocurrency world is buzzing about Steem (STEEM), a blockchain purpose-built for social media and content-driven applications. Despite a temporary market downturn…puncakbukit in lyx • last month[New Coin] 1 LYX = $1.429 USD - What is the decentralized representations of individuals and entities within its ecosystem?(Chart by TradingView) The cryptocurrency market is abuzz with anticipation as LUKSO (LYX) continues its ascent. This innovative layer-1 blockchain, specifically architected for the social…puncakbukit in lyx • last month[New Coin] 1 LYX = $1.559 USD - How does it revolutionize the digital landscape for creators and communities?(Chart by TradingView) The cryptocurrency market is abuzz with excitement surrounding LUKSO (LYX), a groundbreaking project revolutionizing the digital landscape for creators and communities.…puncakbukit in grt • last month1 GRT = $0.141 USD - How does it make blockchain data readily accessible to developers?(Chart by TradingView) The recent market downturn, potentially signaled by a bearish engulfing pattern, may be a golden opportunity for savvy investors to seize long-term positions in the…puncakbukit in grt • last month1 GRT = $0.139 USD - How does it empower developers to build cutting-edge decentralized applications (dApps)?(Chart by TradingView) The cryptocurrency market is buzzing about The Graph (GRT), a pioneering project revolutionizing how we access and utilize blockchain data. While the broader market may be…puncakbukit in devve • last month[New Coin] 1 DEVVE = $1.24 USDT - What is its robust and innovative DevvX blockchain?(Chart by TradingView) The cryptocurrency world is buzzing with excitement as the DevvE Ecosystem (DEVVE) continues to gain traction. This pioneering project is set to revolutionize how we…puncakbukit in devve • 2 months ago[New Coin] 1 DEVVE = $1.32 USDT - How does it empower individuals to contribute to a sustainable future?(Chart by TradingView) The DevvE Ecosystem is generating significant buzz within the cryptocurrency market, offering a unique opportunity to invest in a project that actively promotes…puncakbukit in sbd • 2 months ago1 SBD = $2.85 USD - What is its innovative approach that has the potential to redefine the landscape of digital finance?(Chart by TradingView) The recent market dip, marked by a bearish engulfing pattern, might appear daunting to some. However, seasoned investors see this as a golden chance to accumulate SBD…puncakbukit in sbd • 2 months ago1 SBD = $2.61 USD - How does it maintain a stable value pegged at bottom to the US dollar?(Chart by TradingView) The cryptocurrency market is abuzz with excitement surrounding Steem Backed Dollar (SBD), a half-stablecoin designed to maintain a stable value pegged at bottom to the US…puncakbukit in steem • 2 months ago1 STEEM = $0.212 USD - How does it reward creators and curators directly with cryptocurrency?(Chart by TradingView) The Steem ecosystem is a revolutionary blockchain that empowers content creators by rewarding them directly with cryptocurrency (STEEM). While recent technical analysis…puncakbukit in steem • 2 months ago1 STEEM = $0.239 USD - How does it incentivize valuable content creation?(Chart by TradingView) The cryptocurrency world is buzzing with excitement surrounding Steem (STEEM), a revolutionary platform that empowers creators and communities. While a recent dip, as…puncakbukit in port3 • 2 months ago[New Token] 1 PORT3 = $0.04061 USD - How does it connect Web2 and Web3 through its AI-driven data layer?(Chart by TradingView) The Port3 Network is revolutionizing the blockchain space by connecting Web2 and Web3 through its innovative AI-driven data layer. While a recent bearish engulfing pattern…puncakbukit in port3 • 2 months ago[New Token] 1 PORT3 = $0.0416 USD - How does it seamlessly connect on-chain and off-chain data?(Chart by TradingView) The cryptocurrency world is buzzing about Port3 Network (PORT3), a groundbreaking platform that seamlessly connects on-chain and off-chain data. While a recent dip, as…