Hello, dear traders and investors of the Blurt community!
Let's have a look at the price chart of Binance Coin in the key time frames.
So, in the weekly chart (1W), BNB/USD is forming a bullish candlestick after the Doji from the previous week:
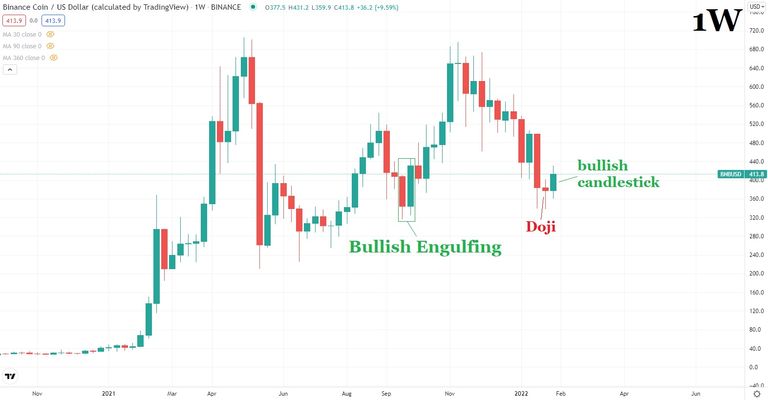
Interestingly, all this is taking place at the level of the previous local high, where BNB/USD formed a Bullish Engulfing. So, definitely, the price of Binance Coin is starting to receive support at the current levels.
Moreover, in the daily time frame (1D) because of the current intra-week rebound, the price of Binance Coin has returned to the 30-day Moving Average (MA 30) and the 360-day Moving Average (MA 360):
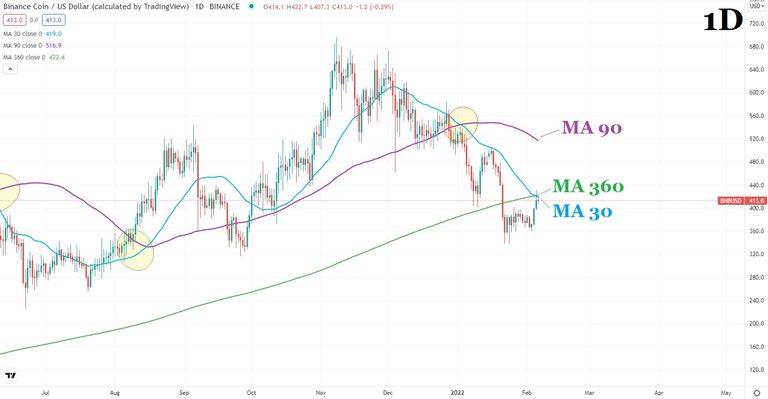
Let's see if the price will be able to surpass these two key MAs and bring an initial positive signal.
For this to happen, first, BNB/USD has to exit in the upward direction the Descending channel (downtrend) in the 4-hour chart (4H):
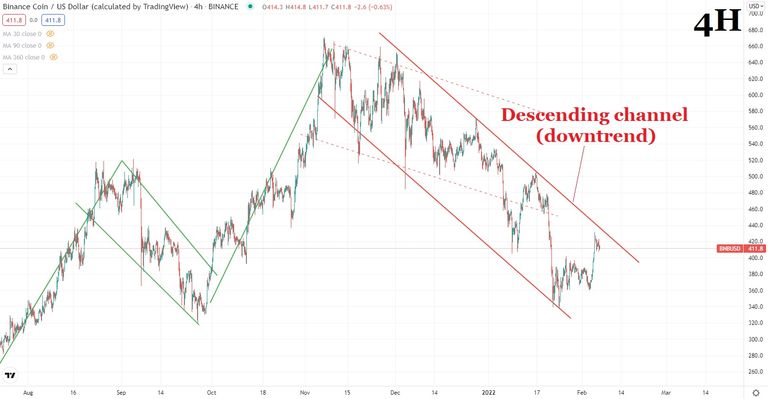
That's why I will keep a close eye on this channel. In case, I see some positive signal I will update you.
To be continued ...
As of the time of writing, one BNB costs $411,80 on the Binance crypto exchange, according to TradingView.
About my experience::
I've been working professionally as a currency analyst for the last 15 and a half years and as a cryptocurrency analyst for the last 4 and a half years.
Important!
Keep in mind, that thoughts expressed here are my own, and they should not be regarded as recommendations for any cryptocurrency/commodity trades, investments and etc.