Introduction
It is with great pleasure that I welcome everyone to the First season and first week of blurttradinghub. The tradinghub is one of the new born innovations on blurt which is being masterminded by @chinonso1. I'm @venom-21, one of the recently appointed lecturers and I'll be handling the intermidiate level. I welcome you all to join me on this journey as we explore the world of crypto through collaborative study and effective research.
For the first week we shall be learning about charts.
Definition Of A Chart
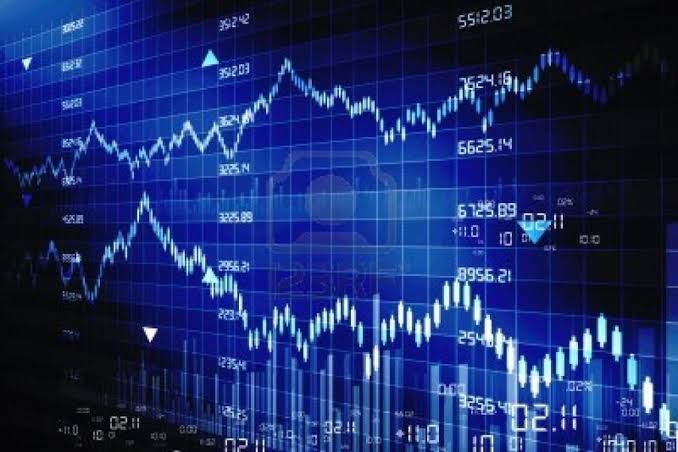
source
A trading chart can be defined as an illustration of the price movement of a security over a certain period of time, these illustrations can be done using symbols, lines, bars, graphs etc. A trading chart comprises of two axis, the vertical and horizontal axis which is also the y-axis and x-axis respectively. The price scale of the asset or security which the chart is illustrating it's price is signified by the y-axis, while the time scale is shown by the x-axis. The price movements of the asset is displayed moving from the left to the right, the latest or newest price of the assets keeps moving towards the right running across the horizontal axis.
Technical analysis was developed in order to be able to properly make analysis and understand the price movements of assets or securities displayed on charts. Charts aid technical analysts and traders in the financial markets to properly analyse the price movement of various assets and securities, hence being able to predict the future prices of these assets and securities.
There are technical analysts who trade exclusively on charts and there are also fundamental analysts who trade exclusively on the fundamental data the chart displays.
Types of Charts
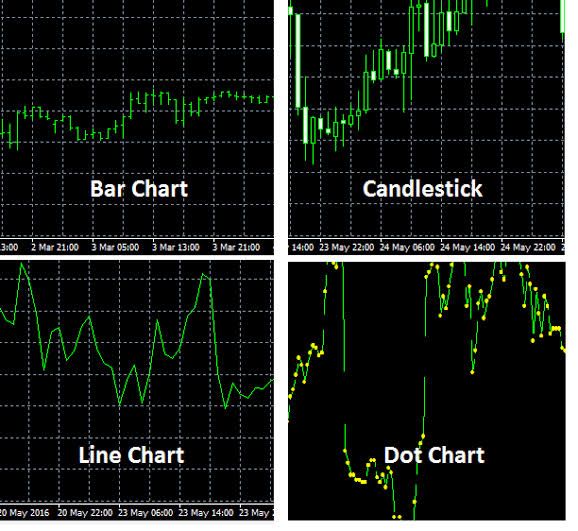
Different types of charts which represent data in different forms have been developed by different people using different concepts and ideas. However the various types of charts used for trading analysis in the financial markets all do the same job, which is simply displaying the price movement of a given asset or security for a given a time frame while moving on a specified direction. There are lots of charts used in the financial market amongst them are; Japanese candlestick, Bar chart, Line chart, Renko chart etc. The 3 most popular charts are, the candlestick chart, the line chart and the bar chart.
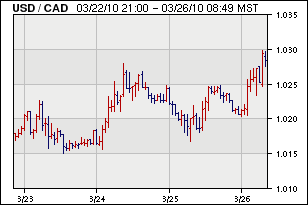
Line Charts
The line chart is one of the charts used by stock traders in the financial market. The line chart has been identified by most as the simplest form of chart because of it's less complex nature. The charts basically displays the closing price movement of an asset or security, in a line chart data is displayed using lines. A line is drawn from one closing price of an asset closing price of that asset continuously for the specified time frame.
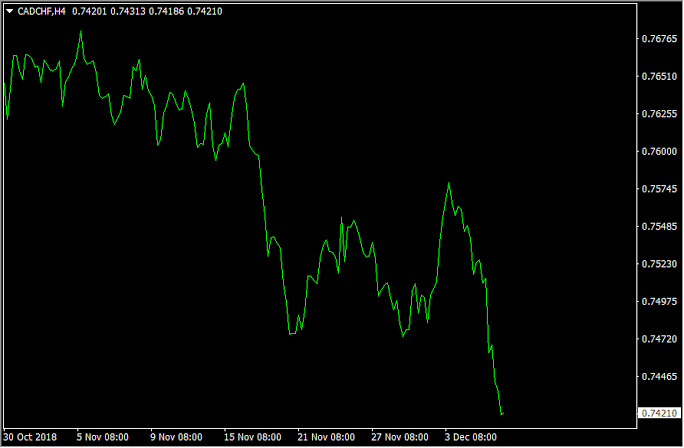
source
Due to the simple nature of line charts they're often used by beginners, because it displays the price data in an easy way. For a beginner in trading, practicing withline chart is adviced for better understanding of the illustrations.
Bar Charts
The bar chart is another chart user by stock traders in the financial market. However, the bar chart is nothing like the line charts, in aspects of it's simplicity and the manner which the price data is displayed. Bar charts shows the opening and closing price of an asset or security and also the highs and lows for the specified time frame. The lowest price which an asset or security is was traded for within a specified time frame is indicated at the bottom of the bar chart, while the highest price which the asset or security was traded for within a specified time frame is indicated at the top of the bar chart.
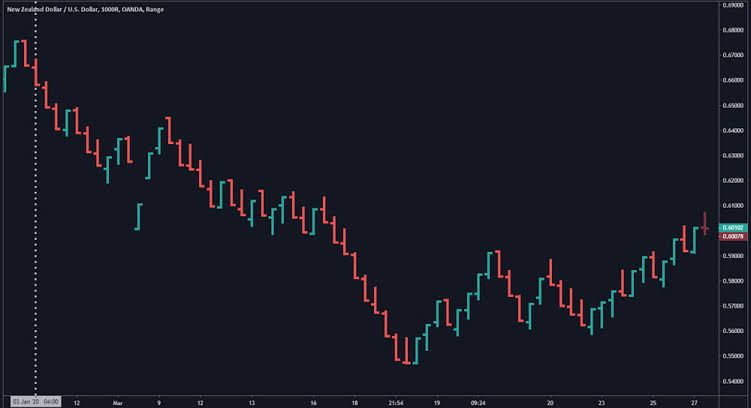
A bar chart comprises of vertical and horizontal bars. The opening and closing prices of the asset or security is shown using horizontal markings which runs through the left and right nofbthe vertical bar, respectively. The vertical bar is used to indicate the connection between the opening and closing prices of an asset within a particular time frame, displaying the data as either bullish or bearish bars( rising and falling, respectively).
Timing Of A Chart
The timing of a chart refers to the time frame which has been used to develop a chart, the timing or time frame can be intraday; 1 minute, 5 minutes, 10 minutes, 30 minutes, 1 hour, 5 hours, 10 hours, etc as long it is within a day. The time frame can also be daily, weekly, monthly or annual. However, the time frames rely on how compressed or detailed the price movements on the chart will be. The information which a chart displays will be more detailed if the data(price movements) is less compressed, the more the data is compressed the more data that will be displayed on the chart but less detailed.
Conclusion
A Trading chart a fundamental tool used in the financial market, charts make trading and analysis easier. It helps stock traders make better decisions in how to trade in the financial market. A trading chart is an essential tool which a trader is required to be properly study. A person with good understanding of charts will definitely make good success in the financial market.
Homework Task
1.) Explain what a trading chart is.
2.) Briefly Explain the candlestick chart without leaving out the key points. (screenshots required)
3.) Explain the major use and importance of a trading chart.
4.) What is technical analysis and fundamental analysis.
5.) Summary
Rules For participation
- #blurttradinghub should be your first tag for easy recognization followed by your country tag e.g #blurtnigeria.
- Use #s1w1venom-21 as your third tag, so that I can easily locate the homework Posts
E.g #blurttradinghub #blurtnigeria #s1w1venom-21 - Introductory post is compulsory.
- A minimum of 100 blurt power is required
- Reblurt compulsory
- Each account is allowed to enter once per week in Each of the levels
- No plagiarism of any kind is allowed
- All materials/images from the web should be properly sourced
- All entry to this course closes by Saturday 7:00pm UTC.
- Your homework Post should not be less than 250 words.
Here is my assignment
https://blurt.blog/blurttradinghub/@ammyy/blurttradinghub-season-1-week-1-introduction-to-trading-charts-intermediate-course-by-ammyy
My homework entry
https://blurt.blog/blurttradinghub/@obikay/blurttradinghub-season-1-week-1-introduction-to-trading-charts-intermediate-course-task-submitted-by-obikay
Also, keep in touch with Blurtconnect-ng family on Telegram and Whatsapp
:::Discord :::Whatsapp:::Telegram :::Facebook Page
Congratulations, your post has been curated by @r2cornell-curate. Also, find us on Discord
Felicitaciones, su publication ha sido votado por @r2cornell-curate. También, encuéntranos en Discord
Please I have a question @blurttradinghub
The introductory post required, is it specifically for the trading class or the general one done for blurt?
Good day, the introduction is the general one for blurt
I am very happy participating in this homework task.... Here is my entry
https://blurt.blog/blurttradinghub/@chaalee/task-submitted-blurttradinghub-season-1-week-1-introduction-to-trading-charts-intermediate-course-submitted-by-chaalee
My entry for this class
https://blurt.blog/blurttradinghub/@hazqdee/blurttradinghub-season-1-week-1-introduction-to-trading-charts-intermediate-course-by-hazqdee