
Edited using canva
Explain what a trending market is.
Trending Market: The crypto market is considered to be trending if the market chart of a specific asset is moving in one direction, it can either be in an upward direction or a downward direction.
When the chart of that specified crypto is moving in an upward direction then we tend to call it a bullish trend.
When the market chart is moving in a downward direction, then we call it a bearish trend.
Bullish Trend
In this type of trend, the market price moves in an upward direction
This formation is a result of the demand of that specific asset being higher than the supply which tends to use obey the law of demand and supply
This is mostly formed in a zigzag direction
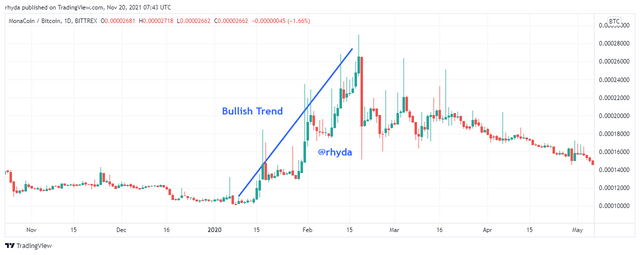
Screenshots taken from Tradingview
Bearish Trend
This type of trend is mostly formed in a zigzag downward direction.
Unlike the bullish trend which forms an upward direction, the bearish is directly opposite that if the bullish whereby the market chart of an asset shows a downward trend.
This is as a result of sellers being more than that buyer in the market
A bearish trend is mostly caused as a result of investors exiting the market.
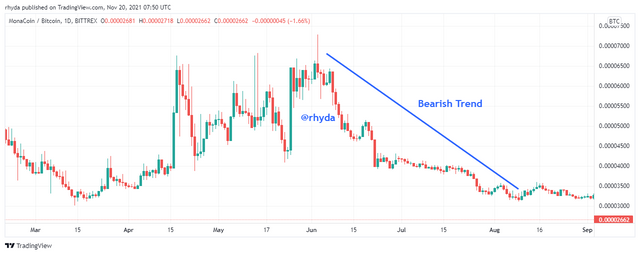
Screenshot taken from Tradingview
Market structure for bullish trend
In this type of trend, the market price moves in an upward direction forming a higher high and a higher lower whereas the new high formed is much higher than the previous high formed thereby allowing traders to enter the crypto market
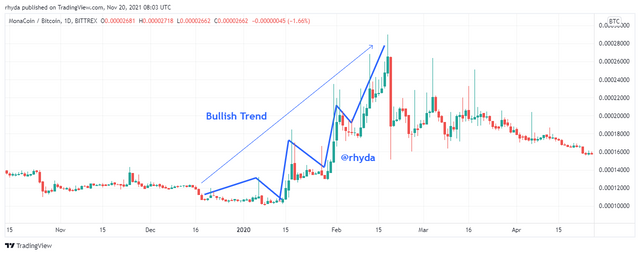
Screenshots taken from tradingview
Market structure for bearish trend
This type of trend is mostly formed in a zigzag downward direction. This direction is a result of the market chart forming a lower low and a lower high whereas the new low formed is much lower than the previous low.
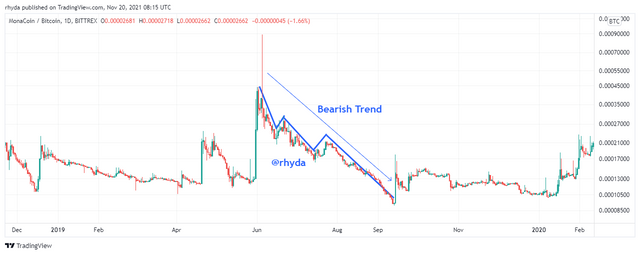
Screenshots taken from tradingview
Bullish Trendline
As the definition of bullish depicts, trendlines are line drown to show the rise in the market within the next few days or hours. With the help of trendline, traders can join major troughs which are done by concentrating on the lows of the market chart which helps them in identifying opportunities and support as the markets rise.
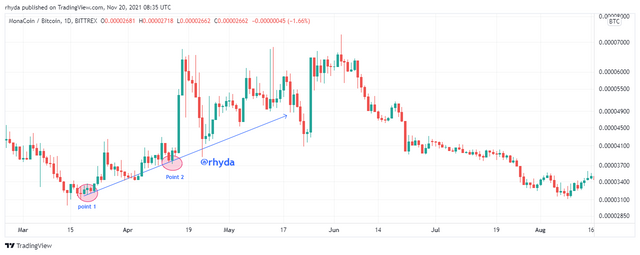
Screenshots taken from tradingview
Bearish Trendline
In bearish trendline, traders concentrate on the lower high and the lower low and when drawing a trendline, they focus on the resistance at the lower level which helps to be able to predict the next phase the market will be taken.
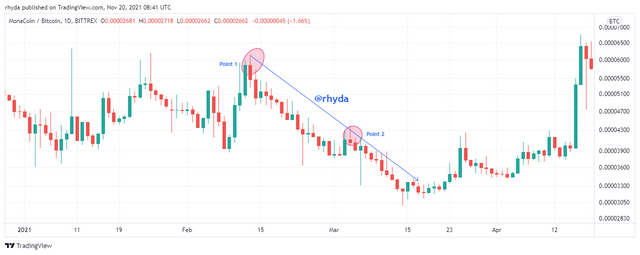
Screenshots taken from tradingview
Choose any crypto of your choice and determine if the asset is trending and the current trend of the asset.
In using BTC/USDT to answer this question, the screenshots below shows that the market chart of the BTC/USDT is moving in an upwards direction which means that the asset is in a trending position.
As the definition of trending states that an asset is considered to be trending if it’s moving in either an upward or downward direction and in the chart below, the BTC/USDT is moving in an upward direction
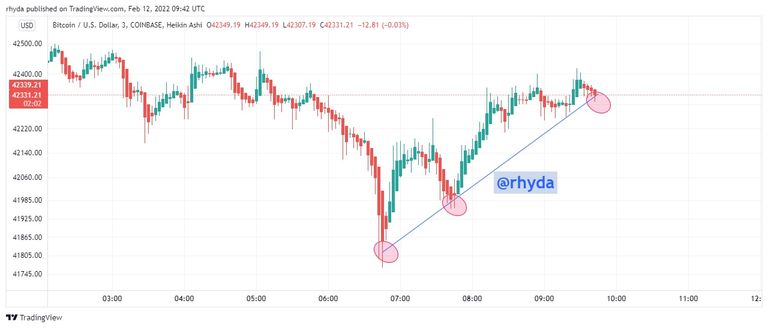
Screenshots taken from tradingview
Conclusion
Market structure and Trendline helps traders when it comes to predicting the next chart to be formed in the crypto market, which is why it is advisable by most traders that when it comes to dealing with cryptocurrency’s you should be able to determine whether the asset you are going in for is in a bullish trend, bearish trend or ranging before buying to avoid running at a loss.
I will also like to say a big Thank You to professor @gunuwan for giving us search a wonderful lecture on market trend.
