1.) Explain what a trading chart is.
2.) Briefly Explain the candlestick chart without leaving out the key points. (screenshots required)
3.) Explain the major use and importance of a trading chart.
4.) What is technical analysis and fundamental analysis.
5.) Summary
1.) Explain what a trading chart is.
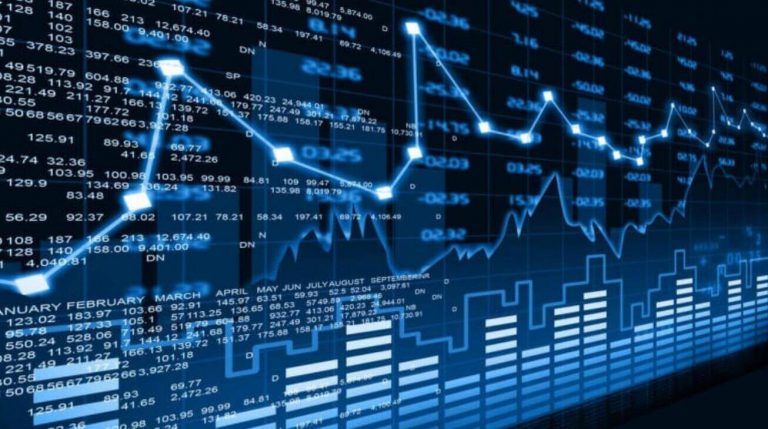
Trading charts are the representations created with the aid of using an asset’s price actions over time, that are utilized by buyers as a part of their technical analysis. Trading charts can create known styles that permit buyers to collect records approximately about what a coin would possibly do next. Though it's not possible to know how the market will react. It is also said that these chart patterns are likely to repeat themselves.
To say, trading charts give the trader reasonable information on an assets, and also aid them in predicting the future. Types of charts include bar, line and the candlestick.

2.) Briefly Explain the candlestick chart without leaving out the key points. (screenshots required)
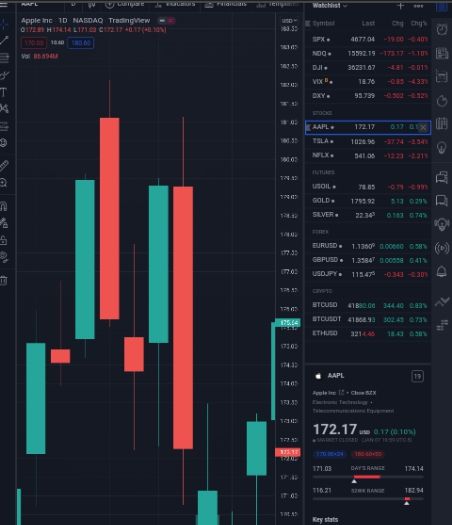
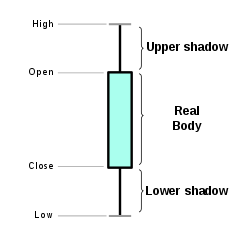
The candlestick chart also called japanese candlestick is used to visualize and examine the movement for stocks, derivatives, currencies, commodities. Candlestick Charts show a couple of price records like :
Open
Close
Highest
Lowest
via the usage of candlestick-like symbols. Each candle shows the compressed buying and selling interest a time period which may be a minute, hour, day, month.
Candlestick charts helps to detect and predict market trends over time and can be used to interpret daily market sentiment, through the coloring and shape of each candle symbol. Candlestick Charts assist in knowing the
market psychology (greed and fear traders experience) via the diverse indicators, inclusive of form and colour, however additionally with the aid of using the various identifiable styles that may be determined in Candlestick Charts.
3.) Explain the major use and importance of a trading chart.
The trading chart is important to traders because it provides them with information that helps them choose or know when to enter/exist a position. It also helps in locating trends and prediction of movement. It can be used for analysis on all markets like shares, commodities etc.
4.) What is technical analysis and fundamental analysis.
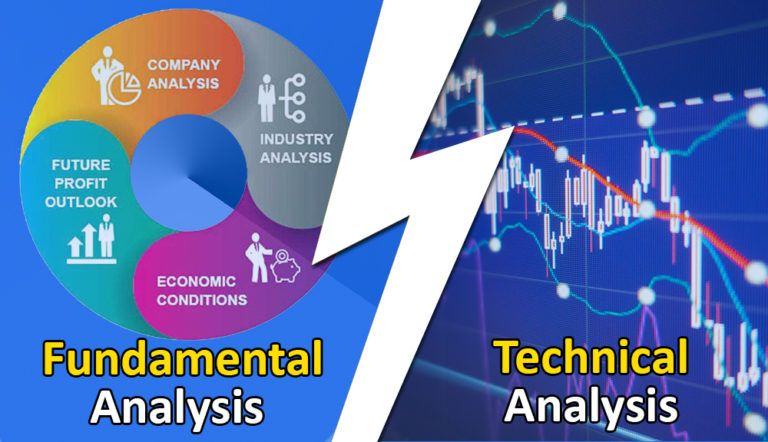
TECHNICAL ANALYSIS
Technical analysis is a quantitative approach that estimates the price of an asset’s movements. It focuses greater on price figures and charts, than the motives behind them. It’s an important a part of intraday and different short-time period of buying and selling activity.
Technical analysis is composed particularly of studying charts on sure timeframes and searching into distinctive indicators, trend traces and indices. With these tool you’ll be capable of decide which manner the trend is going, whether or not an asset is overbought or oversold, to what stage the price of the asset will fall.
FUNDAMENTAL ANALYSIS
Fundamental analysis focuses to approximate the merits value of the asset by collecting into contemplation quantitative and qualitative factors. Its also good for calculating an asset’s attractiveness. The purpose is to estimate whether or not the asset is undervalued or hyped up at a point so as to make a move.
Conclusion
Chart patterns are very essential component of technical analysis. A technical analyst makes use of charts to gather information. Also by using chart patterns it helps a technical analyst to know trading signals.
Thank you for the lecture from lecturer @venom-21
Hello @obikay it's nice that you have done my homework for this week. Below are your grades;
Observations;
• You have attempted all questions and answered completely. But your answers were rather brief, however it was quite straight to the point.
• Your use of markdown is good enough, but still needs improvement.
• You have answered the questions in your own words, and Images are well sourced.
• Try be more detailed in your next homework
Thank you for participating in the intermediate class week 1. I look forward to continue grading your homework.
Congratulations, your post has been curated by @r2cornell-curate. Also, find us on Discord
Felicitaciones, su publication ha sido votado por @r2cornell-curate. También, encuéntranos en Discord