INTRODUCTION
Greetings everyone this is my second assignment for blurttradinghub classes that have just been launched. It is my pleasure to make submission of my assignment post for the class with the topic of Introducing charts by the lecturer @venom-21.
The cryptocurrency market is not which anyone can just jump into, and start making profit. It is one with a lot of risk, changes and instability which is why it is always referred to as volatile because price fluctuations are always happening.
This topic gives the understanding of what trading charts are and why we should study them.
1 Explain what a trading chart is.
TRADING CHART
One of the most important things that must be understood by someone who is looking into trading in cryptocurrency market is the chart.
A chart like many other visual representations is used to make information more clearer and understandable. So we can say that a trading chart is used to show information which can be used for trading, in essence a trader can get information on whether to trade or not and which market he can best make profit from.
On the trading chart there are information displayed of the price movement for that particular market over a time period ranging from seconds to years and display can be in form of lines, bars, dots or candles.
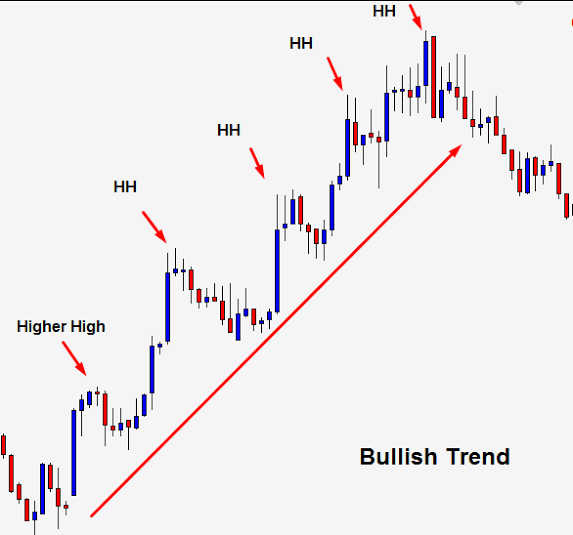
The price movement on the chart make formation of what is called a trend. A trend tells us the kind of movement which the market price is currently trading and with this we can determine the structure of that market.
Trends come in various forms namely Bullish and Bearish trends which are calling trending movement and there's also a ranging movement which is a movement in between a Bullish and Bearish but is neither of the two.
The Bullish trend is when the price movement of that market on the chart shows it moving in an upward movement which is usually called an uptrend.
The bearish trend in the other hand is a downward one and can also be called a downtrend.
All of this points to whether a trader should enter the market by buying assets or by selling assets.
2 Briefly Explain the candlestick chart
Candlestick charts are actually one of the most used charts in trading, it consists of candles arranged in the order in which price moves in the market.
The candlestick appearance depicts the price points namely open and close as well as high and low, so by setting the time period over a specific time range the trader can view the price pattern of the market over a period of time.
This is quite useful as a technical tools for checking and validating data from previous structure of the market.
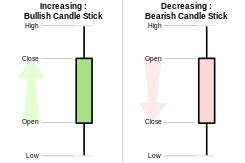
The candlestick compromises of two main parts which is the body and it's wick, on the body we can see the open and close price points while the wick indicates it high and low price points.
As I mentioned the candlestick are formed to indicate price movement, when the candlestick turns green we know there is an upward price change and when it becomes red we know it is a downward price change.
Tracking this over time helps to determine if we have an uptrend or bullish trend or we have a downtrend also called a bearish trend.
3 Explain the major use and importance of a trading chart
Importance of Trading Charts
There are many importance to learning how to read the information displayed on a trading chart and I have listed some of them below.
| Importance | Explanation |
|---|---|
| DECISION MAKING | Understanding the trading chart and how to use it can help a trader make better trading decisions. |
| ENTRY AND EXIT | Trading Charts give you information about the price movement and can help to know which market to enter and exit. |
| PROFIT TAKING | By studying the charts as a trader you have a better advantage of making profit than someone who is just trading blindly. |
| DATA | Studying the trading chart is a source of information and data analysis for traders who want to enter the cryptocurrency market. |
4 Explain what technical analysis and fundamental analysis is
Analysis of information for trading purposes can be very important, one of such done for trading is the technical and fundamental analysis.
Technical Analysis
Technical Analysis involves studying the information or data gotten usually from previous trading and checking how they can be used to make predictions and evaluations for trading in the future.
This is a very useful method into trading as there are a lot of factors which affect the price of a market and by studying how it was affected in the past, traders can make better trading analysis for making profit in new trades.
There are a lot of technical tools used by analysts to study these changes and record the data. Trading strategies and use of technical indicators have been developed because certain trends have been noticed to occur over previous studies when certain patterns appear on the charts.
So armed with this knowledge a trader can enter a market with a lot more confidence when trading.
Fundamental Analysis
Fundamental Analysis unlike the technical analysis involves analysis of present data on events, and external factors which can affect the market and using this as a prediction into where market will be.
This is quite useful if trader wants to know what is happening currently in the market.
5 SUMMARY
The cryptocurrency market is not one where anyone can just enter and start trading, and to prevent loss of funds one of the things a trader should know how to do is to properly analyze charts.
This was a wonderful lecture on an interesting topic. A warm thanks to the lecturer @venom-21 for this class.
Congratulations, your post has been upvoted by @R2cornell, which is the curating account for @R2cornell's Discord Community.
Hello @hazqdee it's nice that you have done my homework for this week. Below are your grades;
Observation;
• You have attempted all questions and answered them completely. I'm quite satisfied with your performance.
• Your use of Markdown is fair enough. You presentation is clear, however there is always room for improvement.
• You wrote in your own words and images were well sourced.
• All your efforts are well appreciated. Thanks for doing the homework for the intermediate class.
I'm looking forward to continue grading your homework.
:::Discord :::Whatsapp:::Telegram :::Facebook Page