
Created with canva

Once you are interested in crypto, you have in one way or the other visited a website to check the price of a cryptocurrency and most of those websites come with a chart that shows you how the prices of the asset are doing at a particular time. Sometimes you see it is moving in a zigzag manner moving upward or downwards, sometimes it's difficult to differentiate if it's moving upwards or downwards, these movements are called market trends.
A market can be said to be trending or in a ranging phase, If a market is said to be trending then it means that the charts of that particular asset show that the prices are moving in a particular direction, where you can clearly distinguish the direction that's the market is moving in. In a trending market, the price of an asset can elaborate move in 2 directions,
- Upward or bullish movement
- Downward or bearish movement
The happens when the prices are well-differentiated and moving in an upward manner. This is the time that the value of an asset rises.
An uptrend is illustrated below.
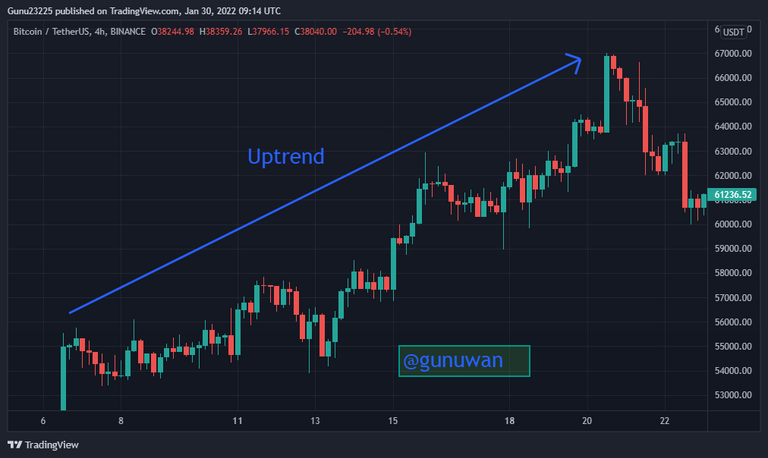 Bullish trend : BTC/USDT
This happens when the prices are well-differentiated and move in a downward manner. This is the time that the value of an asset falls.
A downtrend is illustrated below.
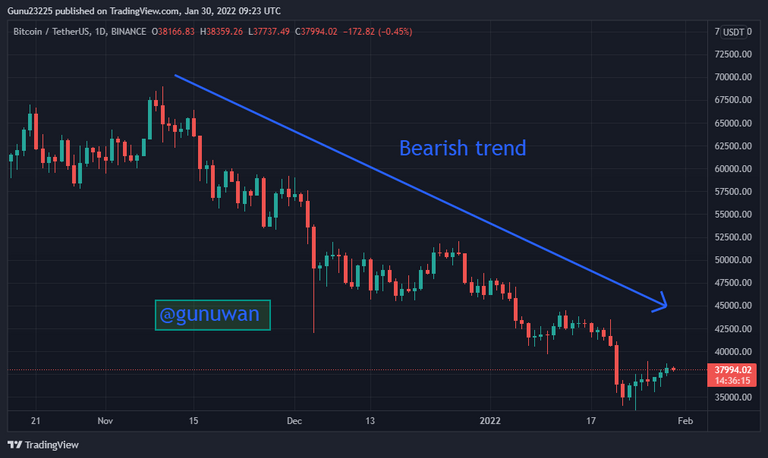 Bearish trend : BTC/USDT
Traders can gain profits from the market because they can distinguish the movement of the market that is, they can move in when the prices are going high or they come moving in when the price is going low.
In a ranging market, the prices of that asset are not quite distinguished, You see that prices are not moving upward or downward, they are just in between.
With the above explanations, I believe it's time for us to know how to identify trends.
A way that we can identify the direction of an asset is by using the market structure method, this method is very simple to use. This can be used to identify an uptrend, downtrend, and a ranging market.
In identifying a bullish trend using the market structure, You'll see prices of an asset forms higher-highs and higher-lows, in such a way that and next high will be higher than the previous high and the next higher-low should be higher than the previous higher-low.
This way, The chart will give a feeling of it moving in a zigzag manner upward. Knowing this gives traders the chance to get good entry points and not Shiva when there's a little retracement to form a higher-low for the continuation of the trend.
An example is illustrated below.
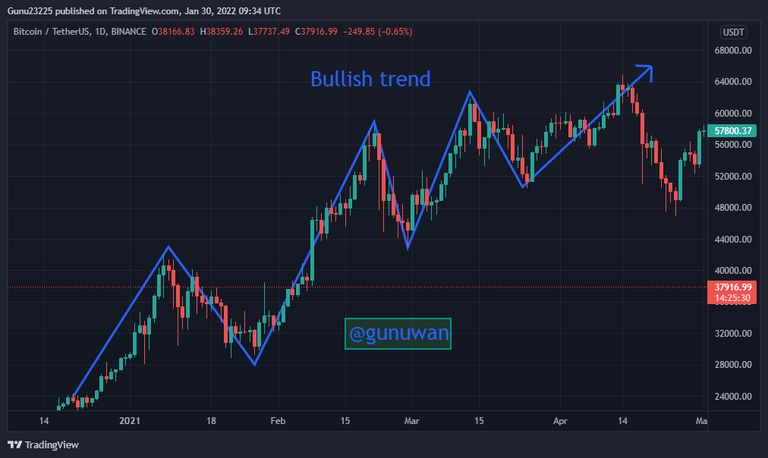 Bullish trend : BTC/USDT
To identify a downtrend, we will notice that the prices of an asset make lower-highs and Lower-lows where a previous lower-high will be higher than the lower-high also, a next lower-low will be lower the previous lower-low.
Once this type of movement is spotted, it means the market is currently in the downtrend and traders can move in to buy an asset at a lower cost.
An example is illustrated below.
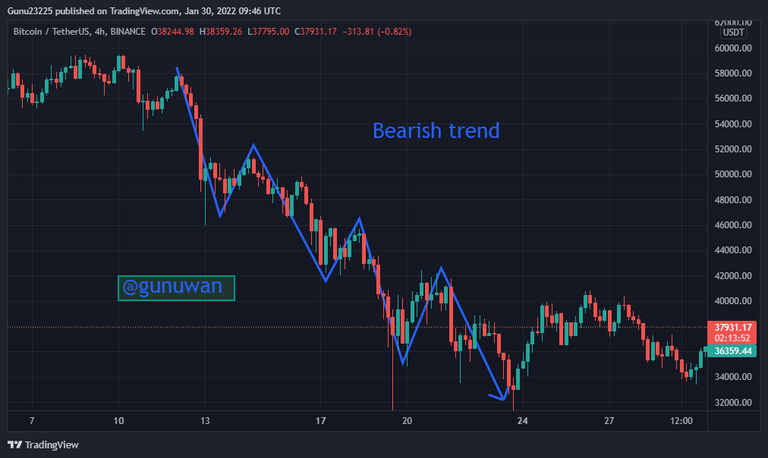 Bearish trend : BTC/USDT
What happens when you can't distinguish whether the market is moving in an upward or downward manner? you see prices moving like it's in a range, not going too much up and not going too much low.
It gives a feeling of there being two lines, the resistance line, and the support line. The support is where the price bounces off and tries to break the resistance line or move above it.
An example is illustrated below.
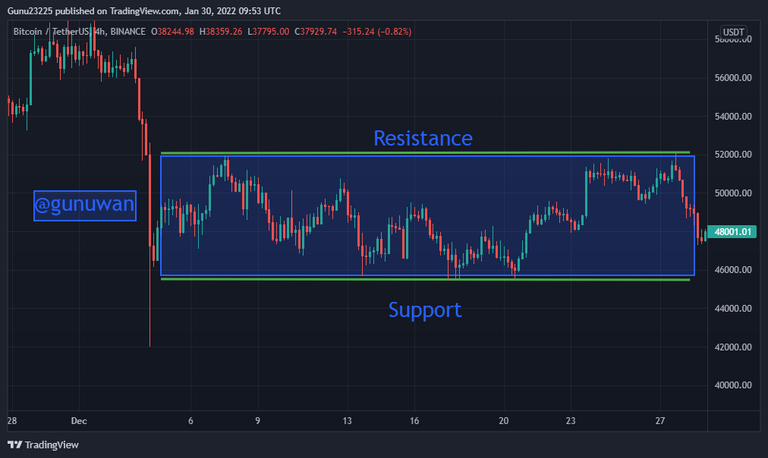 Ranging market: BTC/USDT
Trendlines are also a good way to find market directions. This evolves and a line is drawn to meet certain points of a chart which will determine whether the asset is in an up/downtrend.
A trendline can be drawn to meet two low points of a chart which will signal a bullish trend and a trendline drawn to meet two high points signals a bearish movement.
In an uptrend, Prices will be seen to be trailing above the trendline and prizes will be seen to be trading below the trendline in a downtrend.
A bullish trendline is illustrated below.
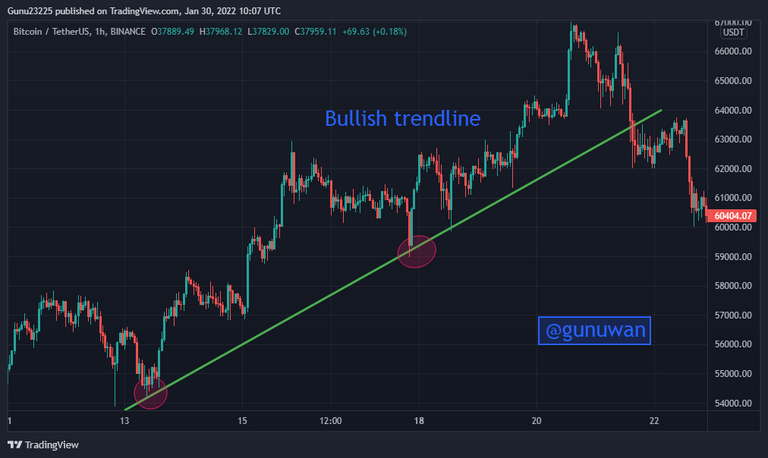 Bullish trendline : BTC/USDT
As explained earlier, Prizes will be seen To be moving below the trendline, and even if prices are to cross the trendline, they either bounce off it and move downward or if there's a strong break of the trendline then a trend reversal could be expected.
A bearish trendline is illustrated below.
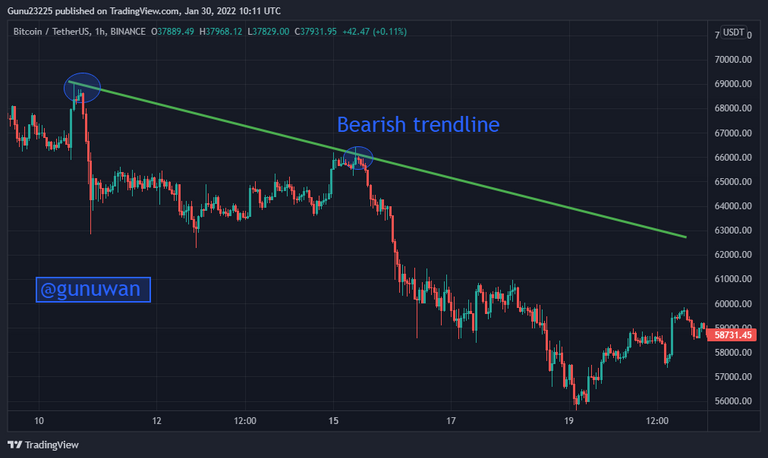 Bearish trendline : BTC/USDT
A trend reversal means a change of trend, could be an uptrend to a downtrend and vice versa.
In the lesson, I have explained how to understand and identify trends using various methods. Every crypto trader in one way or the other has to understand the trends of the market to make more profits from his or her trades.
Everything in this lecture only shows how to understand trends but not how to make trades, trading entails a lot more than just identifying the trend.
We will be learning more about trends and how to use technical indicators to make real-life trades in the next coming weeks.
Thank you for reading my lecture and I hope to see your submission soon feel free to ask me any question at all that you don't understand in my lecture.
Regards, @gunuwan
Please make sure you understand the lecture before you submit your homework post and attempt all questions, and make sure you use your charts. There are a lot of cryptocurrencies out there to choose from.
- Explain what a trending market is.
- What is a bullish trend, explain with a screenshot.
- What is a bearish trend, explain with a screenshot.
- Explain bullish and bearish trends relating to market structure. (Explain with screenshots).
- Explain bullish and bearish trends relating to the trendline. (Explain with screenshots).
- Choose any crypto of your choice and determine if the asset is trending and the current trend of the asset.
• #blurttradinghub should be your first tag followed by your country tag e.g #blurtghana.
• Use #s1w6gunuwan as your third tag, so that I can easily locate the homework Posts. You can add other relevant tags like #trendlines #marketstructure
• Mention me @gunuwan somewhere in your post so I can find your task.
• Introductory post is compulsory.
• A minimum of 100 blurt power is required
• Reblurt compulsory
• Each account is allowed to enter once per week in Each of the levels
• No plagiarism of any kind is allowed. Write your understanding of what you learned.
• Watermark your username on all screenshots.
• All materials/images from the web should be properly sourced
• All entry to this course closes by Saturday 11:59 pm UTC.
• Your homework Post should not be less than 250 words.
• Leave your homework task link in my comments if it's not marked after 48 hours
• You can ask questions in the comments if you don’t understand a question or need clarity about anything in my presentation.
Really wonderful lecture, can't wait to make my submission on this professor
Alright, I'll be expecting.
Hello dear professor @gunuwan, here is a link to my assignment post.
https://blurt.blog/blurttradinghub/@rhyda/blurttradinghub-or-or-season-1-week-6-or-or-market-trends-or-or-by-rhyda