Hello blurtians, It's another great time at the Blurttradinghub. Hope you all are having a good time? Welcome to the 2nd week of season 1 blurttradinghub. For this lecture, we would be looking at Tradingview platform because it is a platform we would likely be making use of in subsequent lectures.
What is Tradingview
Tradingview is a charting platform that was founded in the year 2011 by Denis Global, Andrew Kirillov, Constantine Ivanov, and Stan Bokov. It allows traders to trade and perform technical analysis from its pool of available features. It is used by forex, stock, and crypto traders to analyze and predict these financial markets. It also provides information that can be used for fundamental analysis.
Not to be misconstrued as solely a charting platform, the charting platform has also earned its place as a social network because it connects traders from all over the world, where sensitive and pivotal issues related to the financial markets are discussed.
Tradingview has several notable features and yet adds to its existing features. It is easy to use and has well-descriptive tutorials for beginners. It is available on Windows, Android, and iOS. It has four plans which are: The free plan, Pro, Pro+, and Premium. The features one can access depend on their plan, however, the free plan offers adequate tools for beginners as well as advanced traders.
To participate in live trading with tradingview, a trader has to connect their broker to the platform because it is not a direct trading platform. The platform supports a variety of brokers, some of which are Trade station, OANDA, Gemini, FXCM, Capital.com, AMP, Currencycom, Binex, Timex, and many others.
Before we go any further into the course, let's see how to create a Paper account on tradingview
Paper Trading
You can choose to open a paid account or free account on tradingview.
In this lecture, I will show you how to open a free account on tradingview. On tradingview, this is referred to as paper trading. Paper trading allows you to trade assets like every other live trader except that you don't trade with real money. It can also be used by live traders to test out strategies.
Step 1: Open an account with tradingview by navigating to https://www.tradingview.com/
Step 2: After opening an account, go to chart displayed on the first page or click on the dropdown menu to see it if it is not visually displayed.
Step 3: Go to the Trading panel as shown in the image below.
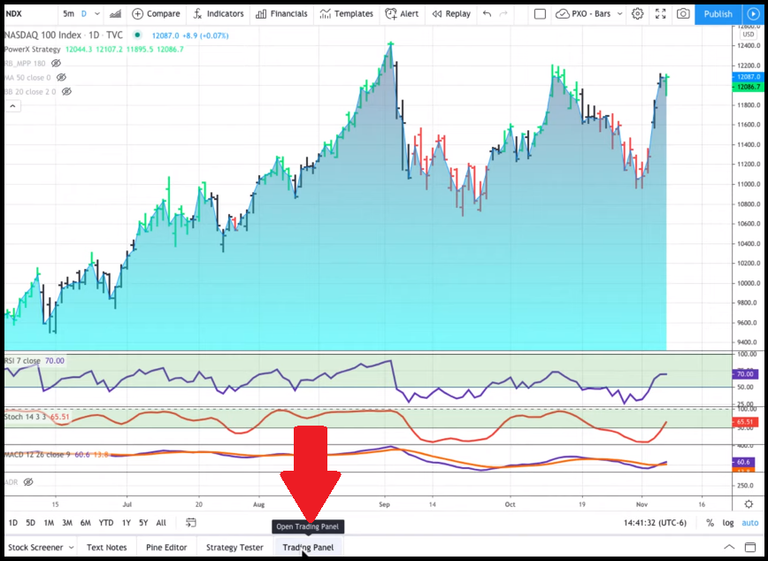
Step 4: select Paper Trading and follow the instructions afterward. Your paper account is credited with the default amount of $100,000 which you can use for trading.


Features of Tradingview
Now that we have an account with tradingview, we go ahead to discuss its features, which of course are too numerous to be fully discussed in this class. The higher the plan, the more the features available to a trader. I believe that those taking this lecture understand the basics of using a charting or trading platform.
Chart Panel
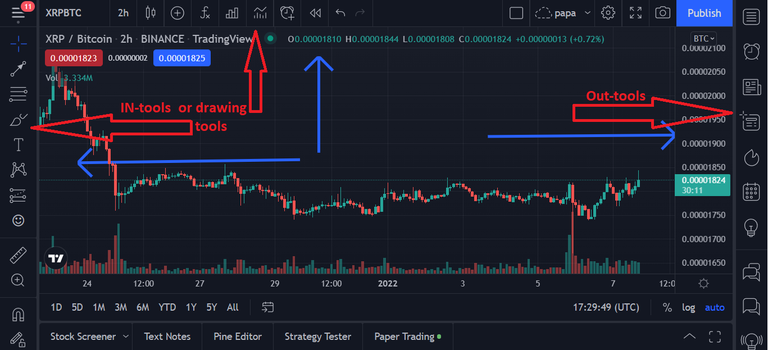
The first and main feature of the platform is the chart panel where we take our trades. To the left is what I call the IN-tools and to the right is the Out-tools. This is because almost every tool on the left side can be directly applied on the chart while those to the right are not applied on the chart but function as external supporting tools for enhanced trading experience.
The IN-tools or drawing tools consist of Lines (various kinds of lines), Gann and Fibonacci tools, Text tools or Annotation tools, Patterns, Predictions and measurement tools (basically used for setting Take Profit and Stop- Loss, and there are other tools found therein. You can see what these tools are used for by hovering over them. The same applies to the Out-tools.
Above the chart are the indicators, indicator templates, candle choice, fundamental metrics, price alert, time frame, and the compare or add symbol. All these have their peculiar functions which you can check out yourselves. Also, we have the Buy (blue)and Sell (red) symbols used to execute trades.
How to make a new chart Layout
Firstly, to select your assets, you type Shift+k and then select the assets/asset of your choice.
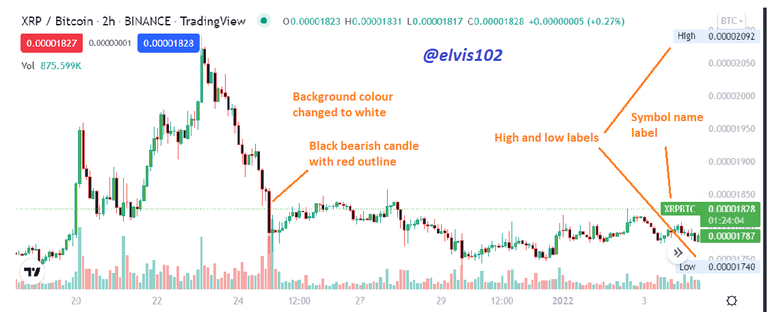
Some traders prefer to have different chart layouts for various trade situations - swing trading, indicator layout, scalping, and price action as the case may be. To create a new chart Layout, you right-click (for PC) and then select Settings. For instance, you can change the color of your candle, the background color, increase the margin, remove the wick, increase the size of the price. It's up to you.
Once satisfied with your chart layout, you can save it by clicking on the drop-down before the settings icon on the upper-right corner of the chart, click save and enter the name you wish to give it. You can also change the name using the rename option.
It's important to know that you can restore your default template by clicking on template under settings and selecting Apply default.
Inserting Drawing tools
Look for the tool you are interested in using in the drawing tools, select and draw it across the chart according to your need. Once done, right-click to de-activate. You can copy and paste the tool for duplicates by using Ctrl + c, and Ctrl + v respectively. Now, if you have a tool you use regularly and may want it handy, you can bookmark it by clicking on the star-like object before the tool so it appears on the main chart panel. Selected tools can be customized by double-clicking on the tool, after which you make your changes. Or you click once and go to settings on the floating bar.
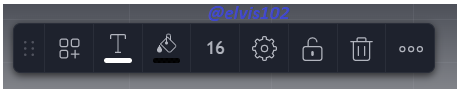
Floating bar
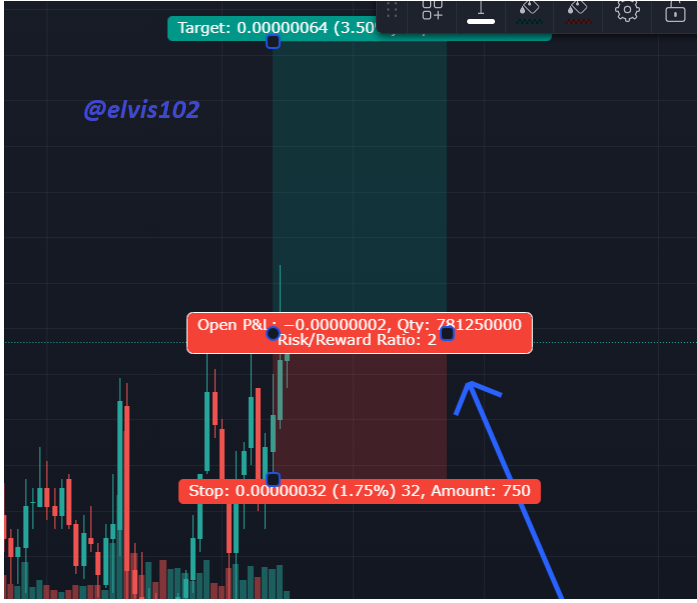
To set your stop and Take profit, you go to Prediction and Measurement tools. When going long/buy, you select the long position and the short position when going short/sell. While doing this, you need to observe the mid-label which shows your Risk-reward ratio. Proper risk management entails that your R:R ratio is at least 1:2. This means that your anticipated Profit should double your anticipated loss.
To delete a drawing tool, you click on the tool once and click on the dustbin icon on the floating bar. You can lock Your drawing tools so that they become immovable by clicking on Lock all drawing tools. This way, your tools are not moved around by mistake, or better still, you hide them by clicking Hide drawing tools. The possibilities with the tradingview platform go on and on.
Object visibility and Editing:
You can choose to make the objects in your chart visible only on particular time frames. To do this, you either select all the objects or hold Ctrl while clicking on the objects to simultaneously effect your changes on all the objects you clicked. Click on settings on the floating bar and make your changes under Visibility. Following this method, you can also edit your objects simultaneously, supposing the changes you want to make evenly applies to all the selected objects.
Price Alert
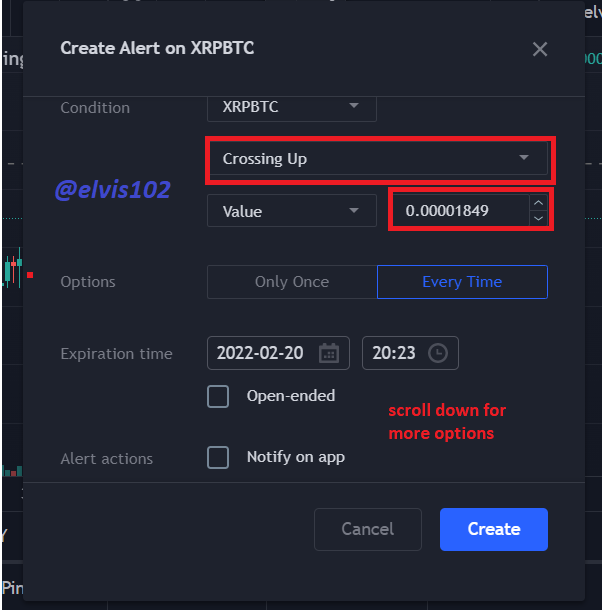
As a trader, you cannot watch a chart forever even if you are a chartist, you may want to be alerted when price meets a particular condition. To set alerts on tradingview, you can either click on the alert icon (looks like a clock) at the top of the chart panel or you right-click and select add alert. You select your criteria and then "create".
On the chart below, I set an alert for XRP/BTC, the condition being that every time price crosses up 0.00001849, I want to receive the alert on my email. This alert expires by 20 th of February as seen on the screenshot.
Indicators
Tradingview is liberal with indicators as there is a large pool of indicators available to a trader for technical analysis.
To use an indicator on your chart, you click the indicator icon at the top of the chart panel and type in either the complete name or the short form of the indicator of your choice.
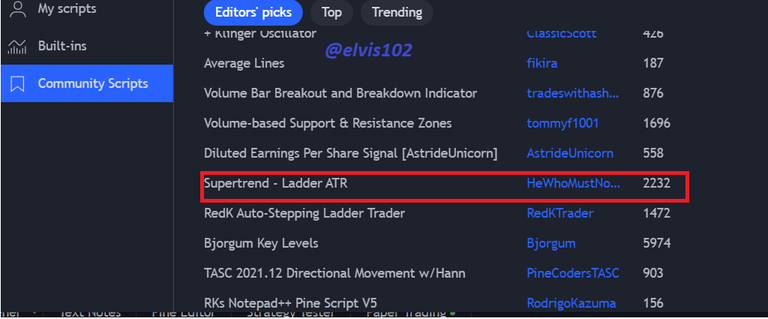
There are built-in indicators and there are customized indicators. Tradingview has over 100 built-in indicators and over 4000 customized indicators built by other developers. This is done using the pine editor or can be uploaded directly on the platform. Built-in indicators are those standardized indicators that are supported by tradingview while the customized indicators are uploaded on tradingview by third parties. You get to see the customized indicators that are highly recommended by viewing the likes on them. These, you can access by either clicking Community scripts or Public places, depending on your trading plan.
For instance, in the screenshot below, you can see that the Supertrend-ladder ATR has more likes than the other customized indicators featured here. This should not be the only basis of use, should you choose any of these indicators for technical analysis. It is also good to look at these indicators at different time frames and backtest before using them in your trading strategy.
Note : You cannot apply over 3 indicators on your chart while using the free plan.
Indicator Visibility
An indicator can be made to be visible on your chart only on particular time frames. To do this, you click on the settings icon on the indicator represented in the chart, go to Visibility and uncheck the time frames where you don't want to see the indicator. By default, all time frames are checked.
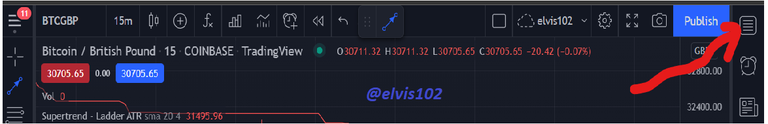
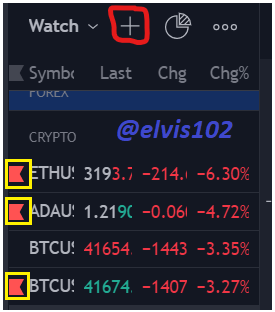
Adding Watchlist to your chart
Instead of always going back and forth to search for favorite assets, as a trader you want to create a watchlist that will contain a list of your favorite pairs. You get to scan the market faster with a watchlist.
To do this, you click on the watchlist icon identified on the screenshot, then you add your favorite pairs by clicking the cross icon. You can also bookmark some that are very important to you at the time.
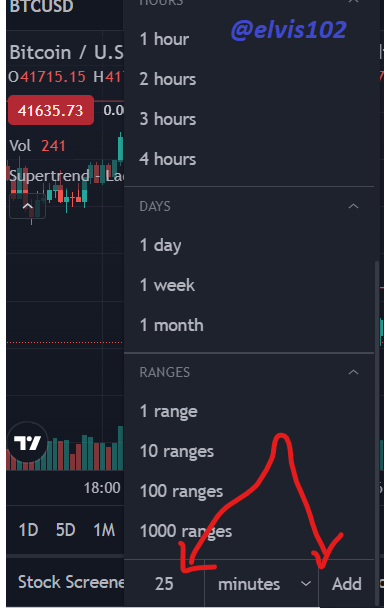
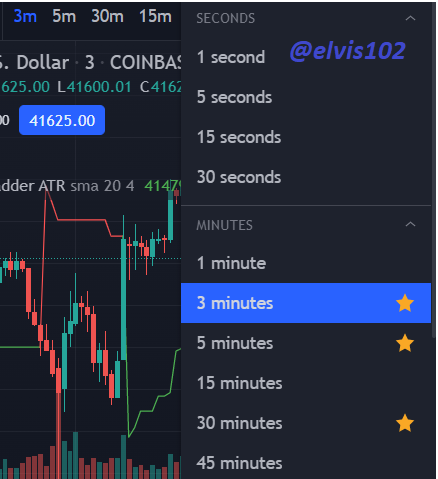
Time frame
Navigate through time frames. The time frame is visible at the top-left corner of the chart. You click and select your choice. Some time frames may not be available to you if you are using the free plan. Also, you (exclusive of the free plan) can set your time frame to numbers that are not made available by default. For instance, you can set your time frame to 22 minutes or any reasonable number of your choice. Also, you can bookmark your favorite time-frames so they can appear at the top of the chart, thus making it faster to navigate through time-frames on the chart.
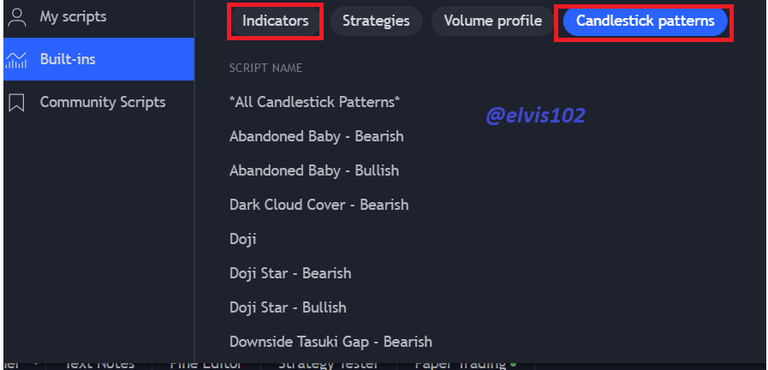
Candlestick and Strategies
As a trader, you can know where certain candlesticks appear on the chart and what they imply. To do this, go to the indicator icon at the top of the chart panel, click on candlesticks patterns and select the candlestick you want to see on the chart. Hover around the candle label now in your chart and you get to see the implication of the candle formation. Candlesticks, however, should not be traded in isolation.
You can also apply any available strategy from the Strategies option you see before the candlestick Patterns. You must well understand the strategy you pick and the risk it poses to you as a trader.
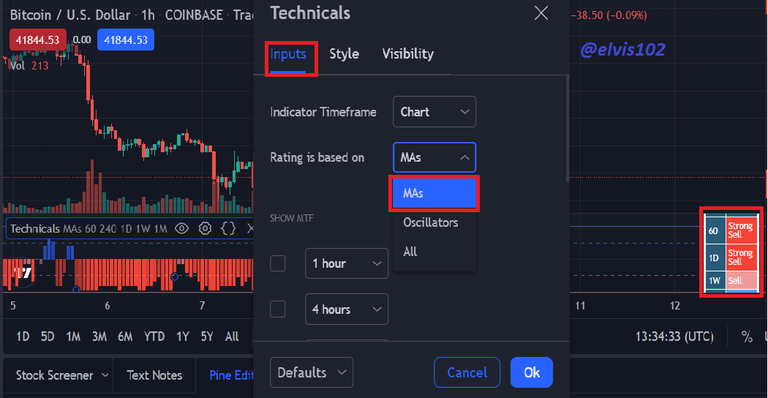
Technical Ratings
This is a relatively new feature of the platform. It is a technical analysis tool that provides a trader with the ratings of different technical indicators. It gives you the combined results of several oscillators or moving averages or all combined. To apply this to your chart, you go to the indicator icon, search for technical ratings and then utilize the settings on the indicator to set what you want to see, whether the result of the moving Averages or the Oscillators or all combined. See the image below.
Quick tool search
For an enhanced trading experience, you can get any tool you want to use by typing Ctrl + k after which you can search the desired tool on the search bar.
Backtesting
To backtest on tradingview, you ought to have a paid plan. To backtest your chart, click on the Bar Replay icon << on top of your chart and then use the blue line to signify the point from which you wish to backtest while setting the speed at which the chart unfolds.
Fundamental analysis tools
There are tools you can use on tradingview for some form of fundamental analysis. Some of them are:
Screener
News
Community engagement
Spark
Hotlist.
All these features apart from the hotlist (located to the right of the chart panel) can be accessed from the drop-down menu on your first page.
The platform also has a pine editor where you can write your code for your customized indicator. This is located below the main chart panel.
Conclusion
Tradingview is a notable charting platform with over 30 million members and a great community that offers a wide variety of knowledge on forex, stocks, and cryptos.
It is one of the best platforms beginners and even advanced traders utilize for technical analysis as it provides a variety of tools that are useful and easy to use. The platform keeps on upgrading its features and has very few competitors at the time, making it a very suitable charting platform for live and demo trading.
Thank you for following through. See you in the next class.
HOMEWORK TASK
1 Create a new chart layout on tradingview with the following features
- White background
- Bid and Ask labels
- 5mins, 30mins, and 2hr time frame visible on the chart
- Blue watermark
- Remove the Open, high, close, close (OHLC) on the chart
- Save the new chart layout with your username
2 What is the screener used for. (Provide a screenshot of BTC/USD information displayed by the screener)
3 Describe the uses of ten shortcut keys that can be used on tradingview
4 Using the Compare or add symbol tool, briefly compare two asset pairs (Provide screenshot)
5 Go to the cryptocurrency niche under Idea in the community section. Engage any topic and briefly explain your observation. (Provide a screenshot of the image discussed)
Good luck!
RULES AND GUIDELINES
#blurttradinghub should be your first tag for easy recognization followed by your country tag e.g #blurtnigeria.
Ensure to use #h3week1 as your third tag.
E.g #blurttradinghub #blurtnigeria #h3week2Introductory post is compulsory.
100 blurt power is required
Content should not be less than 250 words
Reblurt compulsory
Please avoid plagiarism
All materials/images from the web should be properly sourced.
Submit the link to your assignment in the comment section.
Entries close on Saturday 15th January by 6pm (GMT+1).
Great delivery you did. Good job!
Congratulations, your post has been upvoted by @R2cornell, which is the curating account for @R2cornell's Discord Community.
:::Discord :::Whatsapp:::Telegram :::Facebook Page
https://blurt.blog/blurttradinghub/@ugochukwuprospe/homework-task-on-blurttradinghub-season-1-week-2-exploring-tradingview-advanced-course-for-prof-elvis102-by-ugochukwuprospe
Here is my entry to the lecture
https://blurt.blog/blurttradinghub/@rich-ben/tradingview-by-rich-ben