Good days guys
Today I'll be taking my first assignment in the recently launched @blurttradinghub classes which is the intermediate level held by @venom-21 on trading charts
Question 1
Explain what a trading chart is
Source
A trading chart can simply be defined as a pictorial or visual illustration of the price movement (increase or decrease in prices) of securities for a certain period of time which can be in minutes, hours, days or even years depending on the choice of the trader.
The chart consists of the x-axis which depicts the time scale and the y-axis which depicts the price.
The trading chart helps the trader to make decisions on whether to go ahead with investing in a trade or to back out.
The pattern which the price movement forms is known as a trend.
The trend is divided into many types but the two major ones are the bullish trend and the bearish trend.
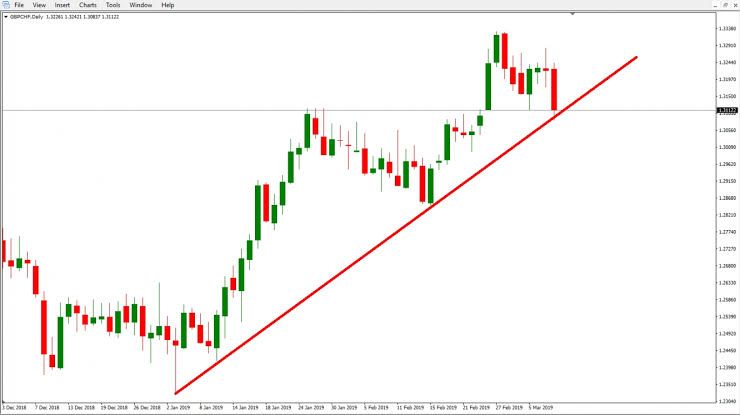
The bullish trend occurs when the price movement on the chart moves upward as illustrated below
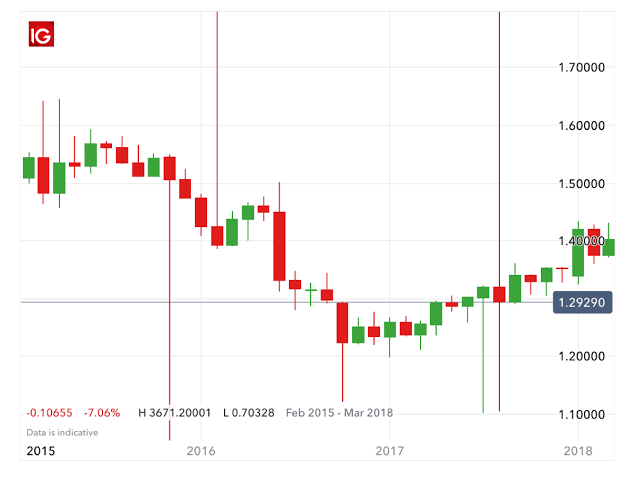
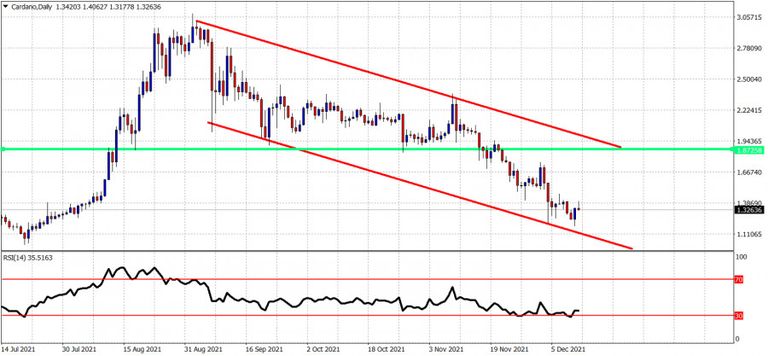
The bearish trend occurs when the price movement on the chart moves downwards as illustrated below as well
Question 2
briefly explain the candlestick chart without leaving out the keypoints
Candlestick chart is a price movement chart that's similar to the line graph and the bar graph that was treated in the lecture but it is the most used by traders as it is very easy to read and traders can get all the required information they need like the opening and closing price as well as the highest and lowest price an asset has attained in a specific time frame
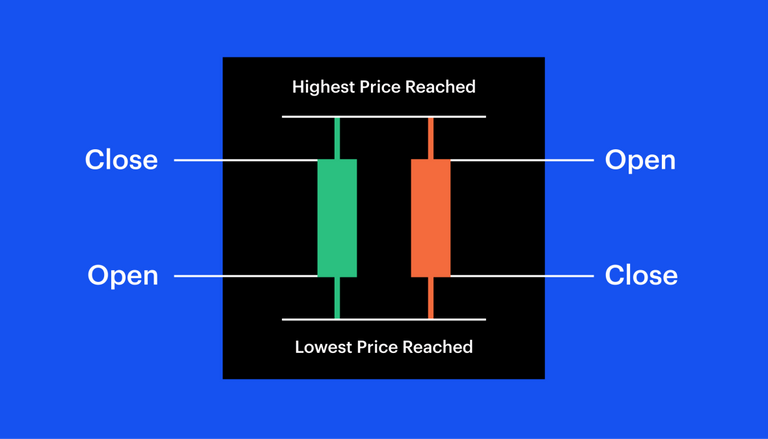
The chart just like its name implies consists of candlesticks.
The candles come in 2 colours. The green candle depicts an increase in price of an asset while the red candle depicts a decrease in price of an asset.
Question 3
Explain the major use and importance of a trading chart
Importance of trading charts
Trading charts tend to help in so many ways but they can be summarized into 3 major points
- Gathering statistics and data: a good understanding of trading charts aids the trader in gathering data about various trading options available
- making decisions: when a trader has grasped a good understanding of trading charts. He gains a better insight on making trading decisions like trades to invest in and trades to avoid
- risk management: a good understanding of trading charts helps the trader to know the perfect time to take profit from trades. This helps to maximize profit and minimize loss
Question 4
What's the difference between fundamental analysis and technical analysis?
Technical analysis involves the study of the past statistics of trading in order to predict the future market prices of assets
This particular method of analysis gives the trader an insight on what the worth or value of an asset is in the eyes of the market.
The technical analysts believe the current price of the asset reflects the its worth in the eyes of the market and traders make use of it to make future predictions and investment decisions
While
Fundamental analysis involves the study of current value or price of assets and predicting it's future value by taking note of all possible factors which can influence it.
Fundamental analysts make use of the big picture approach to predict an asset's future value based on its intrinsic value
This is different from technical analysis in the sense that it only focuses on the current price without taking the past records into concern
Summary
In the post, we talked about the trading chart which is a basic tool that helps traders to understand the present price movement and also predict future values of assets.
We also talked on the candlestick chart which is a type of trading chart that provides a quick overview of the price movement of an asset to traders
And we also discussed on the two types of trading analysis we have; technical and fundamental analysis.
I believe traders can minimize the risk and loss while trading by applying the strategies and tools discussed above
Remember
there's no business with zero risk
Thanks for providing this platform for us to increase our knowledge on cryptocurrency @blurttradinghub
Kudos to the lecturer @venom-21
Hello @cyberking25 it's nice that you have done my homework for this week. Below are your grades;
Observation;
• You have attempted all questions and answered them completely.
• Your use of Markdown is nice. But you still need to develop more on that.
• You didn't quite write in your own words, I discovered some content spinning. Images were well sourced. Try to be more original in your next homework.
• All your efforts are well appreciated. Thanks for doing the homework for the intermediate class.
I'm would like to continue grading your homework.
:::Discord :::Whatsapp:::Telegram :::Facebook Page
Congratulations, your post has been curated by @r2cornell-curate. Also, find us on Discord
Felicitaciones, su publication ha sido votado por @r2cornell-curate. También, encuéntranos en Discord