INTRODUCTION
This week's homework task is really going to be an amazing task. Considering the fact that this is the first task in the trading hub, I have already felt how it will be of great impact and importance to all blurt users. Cryptocurrency on it own is very difficult to understand, but through this wonderful initiation and lesson, we will be able to grab more knowledge on cryptocurrency and to know more about blockchain technology. Starting the class with a topic on trading chart is truly a sole reason why this program will be a huge success. I have read all and I have understood everything here. I always want to thank @venom-21 for bringing such a beautiful topic to kick off the trading hub. Below is my detailed homework.
1.0 what is a trading chart?
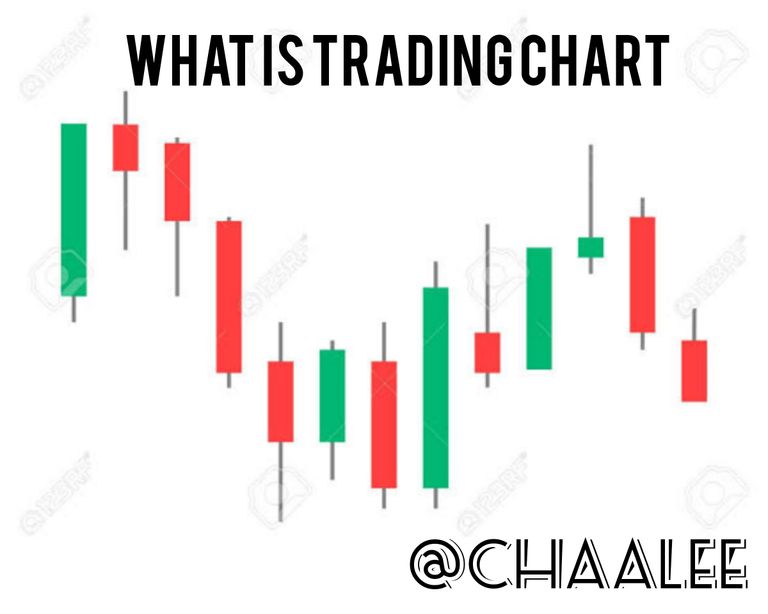
Just like every chart used in displaying informations, a trading chart is an interface which displays a price or value of an asset within a time frame. Through the trading chart, informations concerning assets of different time will be displayed and will constantly change depending on whether the price depreciates, or appreciates.
Lots of people trades different assets everyday, it is now under the study of the chart's trend that we can be able to tell whether they are moving up, down or across. Now knowing theoritically about trading chart is never enough. A good trader has a sole ability of knowing how to read or understand a chart in order to become even better. Always remember, the chart displays information on an asset and are usually plotted and shown on a graph.
Now, there are different terms used in reading or understanding the types of trends while trading. Let's quickly look into these trends.
1.1 Understanding trends
These trends helps traders to indicate specifically the directions of an asset with time. You might want to know what a trend is; when a price moves upward, downward or sideways, then it is refered to as a trend.
With this, we can logically say that there are three types of trends;
- The bullish trend or upward trend
- The bearish trend or downward trend.
- And lastly, the sideways, flat or horizontal trend.
Explanation
The bullish trend indicates the upward movement of the price of an asset.
The bearish trend indicates the downward movement of the price of an asset.
Lastly, when the price of an asset moves horizontally on a trading chart, it is said to be sideways trend.
2.0 Briefly Explain the candlestick
Now to the second part of this homework task, I will be explaining the briefly the candlestick chart.
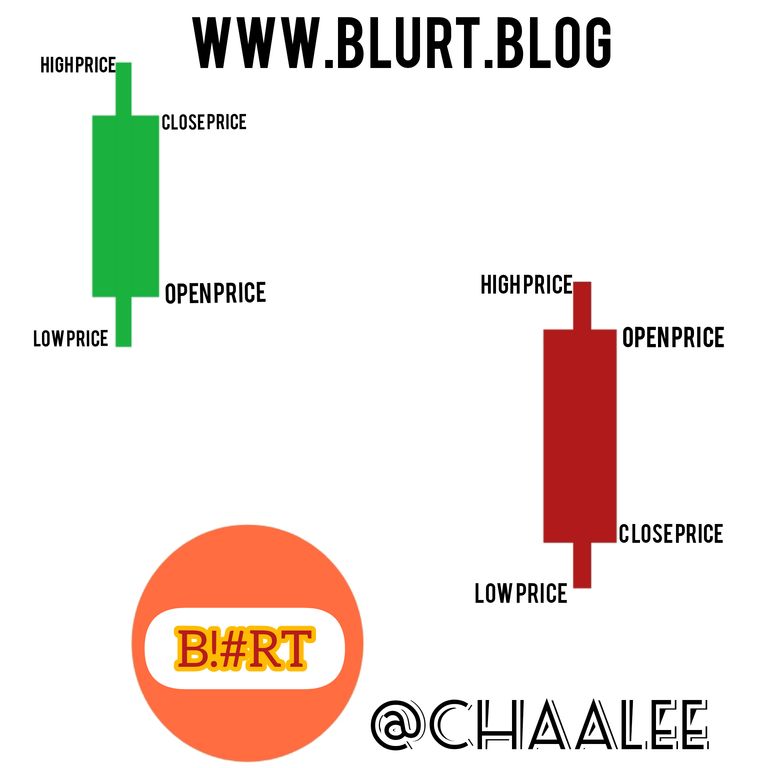
Candlestick is the most reliable chart used by traders to determine asset's price. They indicates the right notch for the trader by displaying four different price points (open, close, high, and low).
the candlestick components and explanation.
The candlestick shows the high, low, open and close market of an asset for the day.
Now, the candlestick has the real body which is also known as the wide body that indicates or shows the open and close of a market for a day.
It also have the wicks at the top and bottom of the wide body, indicating the high and low price for the day.
The candlestick has two colours to indicate either the upward or downward movement of the price of an asset. These colours are usually green for upward movement and red for downward movement.
Check picture below.
Now these wide body and wicks also have their own labels with specific meanings...
Okay, when the upper wick on the red candlestick (downward) is short, then we can say that the open price for that day is close to the high price and vice versa.
And also, when the wick on the green candlestick or upward candle is short, then we can say that the closing price is near the high price.
As a trader, you should know that there is a high relationship between the days, and also the high and low, close and open, which also determines how the candlestick look.
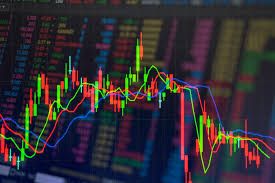
3.0 Explain the major use and importance of a trading chart.
In this third part, I will be explaining the major use and also, the importance of a trading chart.
The major use and importance of a trading chart is to help traders in indicating the high and low prices of an asset. When traders studies the chart, they do so to achieve one goal, which is profit. Through the information depicted on the trading chart, it helps traders to predict it next movement and also, careful understanding reduces lost in the trader's course of action.
4.0 What is technical analysis and fundamental analysis.
source
On this fourth part, I will be giving clear explanations on what a technical and fundamental analysis is.
4.1 Technical Analysis
All we've talked about today is about reading and understanding the trading chart. Now, in terms of technical analysis, these requires the trader using real world data, or past informations to try to predict the future price of an asset. To undertake technical analysis, you should be able to understand the past records and statistics of the crypto currency in study. You should be able to study it volume and movement.
The technical analysis is a method used by most Crypto traders to predict the future price of a currency in question.
The Dow theory is the major idea in which the technical analysis depends on. This theory, In cryptocurrencies, requires the trader's knowledge on the past, present and future demands, which in turns determines the trend of the cryptocurrency.
Most traders on this fact make predictions based on the collective records on such asset or crypto. Now, when dealing with technical analysis, the traders always believe that the movement or trends of a price is never random but instead, depends on either a short or long term movements. In short form, this depends on what is actually happening on the trend than why it is happening.
4.2 fundamental analysis
Unlike technical analysis that uses past statistics, the fundamental analysis is a method that deals with evaluating the current price or value of a currency by analysing both the external and internal factors that could possibly influence it future price.
We say technical analysis studies an asset's statistics, while fundamental analysis looks at the factors outside the asset's price itself.
Some of these factors includes demands, return on equity, profit margins, and other data .
5.0 Summary
All we've discussed today is basically on trading. First we talked about the trading chart which is an interface that shows and give informations of an asset trend, whether upward, downward or horizontal trend. We also discussed the candlestick chart mostly used by traders to determine the future price of a currency. This candlestick is very important in reading the asset's price, considering it wide body and it two wicks, up and down.
Traders trades and acquire all these knowledge in order to minimize the rate of lost and also, make profit while trading. This is one major importance of the trading chart. It gives clear informations and details on an asset in question. We have also discussed both fundamental and technical analysis. The technical analysis which involves past records on an asset and on the other hand, the fundamental analysis, which deals with the current factors affect the asset's price.
This week's task is a wonderful one and has given me more insight on trading. With such daily or weekly tasks, we will be able to build a solid foundation in cryptocurrency and in the blockchain world at large. Thank you all.
Congratulations, your post has been curated by @r2cornell-curate. Also, find us on Discord
Felicitaciones, su publication ha sido votado por @r2cornell-curate. También, encuéntranos en Discord
:::Discord :::Whatsapp:::Telegram :::Facebook Page
Hello @chaalee it's nice that you have done my homework for this week. Below are your grades;
Observations;
• You have done a good job. All questions were properly attempted , but some points were lacking.
• Your use of markdown is fair enough, but you could have justified your work, that would make it look a bit more organized.
• Images were properly sourced, but you could have mentioned the origin of the unsourced Images.
Thank you for participating in the homework task. I'ld love to keep grading your homework.
Thanks sir... The unsourced images was mine. Thanks anyways, I'll indicate next time.
Hello @chaalee, you have received your reward for taking part in our homework task.
You have done well to post your original content.
See you soon!
Thanks
Looking forward for more... Thanks