Well, it seems that the TOTAL is looking for support around a recurring bottom, the 0.618 FIBO Level (2.516 Trillion) of the last bullish Leg.
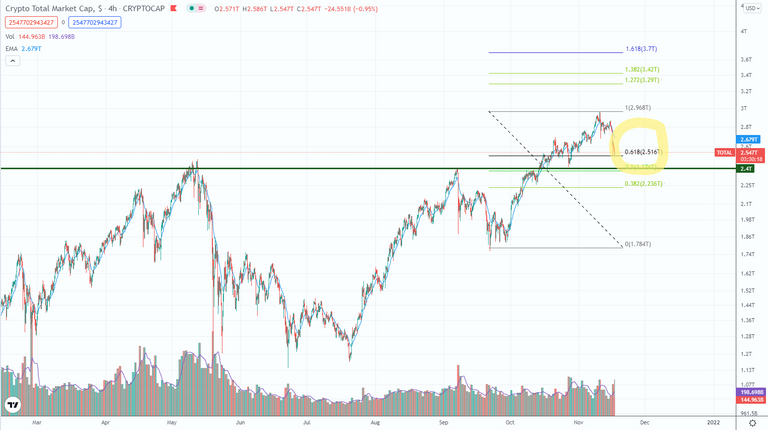
As I have said, this level is usually key in corrections and would represent a fall of more than 16% from its top of 3 trillion.
However, it does not seem that there is a confluence with a Major-support that would be a little lower, towards 2.4 Trillion.
In any case, if the TOTAL fails to bounce where we are now, I expect a great re-test of the Major-suport, representing that we would fall by approximately 5% more...
This would put BITCOIN in support towards $55,000 as a possible ground to bounce off strongly.
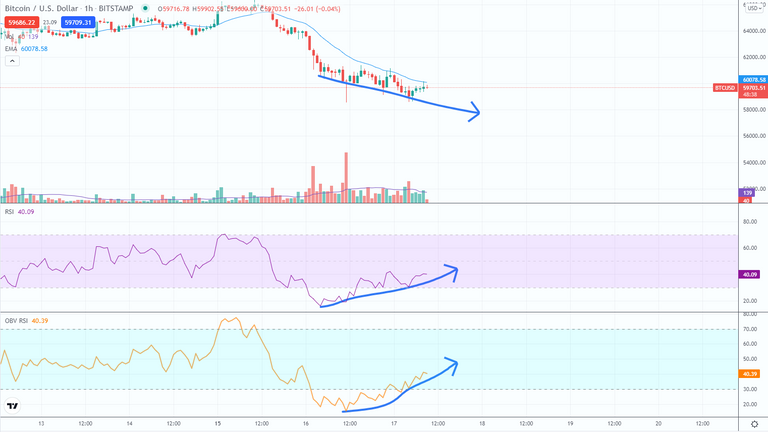
Surely you have already noticed but if you take a look at the 1 Hour timeframe, the price of BITCOIN presents an obvious Bullish Divergence against both the RSI and the OBV indicators.
When this happens especially in BTC, this usually indicates a REVERSAL UPWARDS but, we should have a substantial increase in trading volume.
Enjoy!
*Disclaimer: This is just my personal point of view, please, do your own assessment and act consequently. Neither this post nor myself is responsible of any of your profit/losses obtained as a result of this information.
Thank you for using my upvote tool 🙂

Your post has been upvoted (13.16 %)
Delegate more BP for better support and daily BLURT reward 😉
@tomoyan
https://blurtblock.herokuapp.com/blurt/upvote