
source
On publish0x platform, you can change tipping % so I am going to do 3 visualization.
- 20% to author / 80% to me
- 50% to author / 50% to me
- 80% to author / 20% to me
to see how ETH tipping value is going to be affected.
(also BAT and LRC tokens)

This time I have done, 20% to author / 80% to me for 1 week and see what happened.
Here is the data I have collected and it looks like this 👇
# 20/80
tipping_data = {
    '1': {
        'eth': [0.00002799, 0.00002823, 0.00002823],
        'bat': [0.0828, 0.0409],
        'lrc': [0.0404, 0.0408]
    },
    '2': {
        'eth': [0.00002773],
        'bat': [0.0728, 0.0182, 0.0177],
        'lrc': [0.0685, 0.0342, 0.0334]
    },
    '3': {
        'eth': [0.00002970, 0.00003022],
        'bat': [0.0349, 0.0186],
        'lrc': [0.1534, 0.0383, 0.0383]
    },
    '4': {
        'eth': [0.00011660, 0.00005830, 0.00002915, 0.00002915, 0.00002929],
        'bat': [0.0, 0.0],
        'lrc': [0.0326, 0.0326]
    },
    '5': {
        'eth': [0.00005899, 0.00002950, 0.00002957],
        'bat': [0.0654, 0.0158, 0.0158],
        'lrc': [0.0344]
    },
    '6': {
        'eth': [0.00011296, 0.00005648, 0.00002824, 0.00002844],
        'bat': [0.0166],
        'lrc': [0.0347, 0.0347]
    },
    '7': {
        'eth': [0.00003037, 0.00012029, 0.00006015],
        'bat': [0.0191, 0.0191],
        'lrc': [0.0332, 0.0340]
    },
}
I am going to take this data and feed the data into python plotly script that I made the other day.
Looks like this 👇
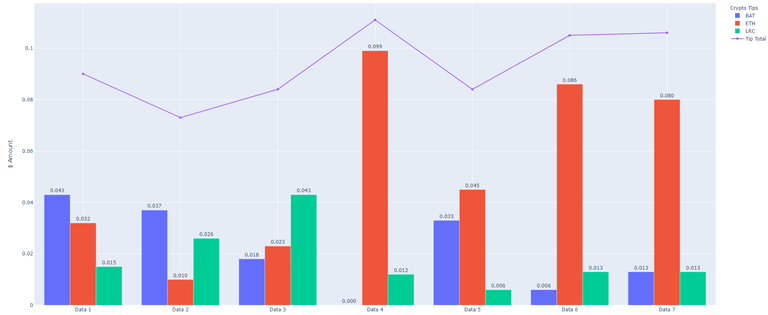
and you can see the graph here.
https://floating-meadow-28045.herokuapp.com/chart-20-80
https://tomoyan.github.io/chart-20-80
Tipping earning avg is about ~$0.10 a day.
I think the average 20/80 tip earning used to be like $0.08 so it seems like they did really increased the reward %. (or it could be the ETH price)
1 week Average: $0.093
ETH Average: $0.054
BAT Average: $0.021
LRC Average: $0.018
(exchange price is done by using coingecko API)
It is nice to see that they are giving more ETH > BAT or LRC.
Next week I am going to do 50/50 and see how this is going to change 😉
My Script 👇
from tip_data import tipping_data
import plotly.graph_objects as go
import requests
import statistics


def get_price(id):
    # Call coingecko API to get usd price
    base_url = 'https://api.coingecko.com/api/v3/simple/price'
    eth_url = '?ids=ethereum&vs_currencies=usd'
    bat_url = '?ids=basic-attention-token&vs_currencies=usd'
    lrc_url = '?ids=loopring&vs_currencies=usd'

    if id == 'ethereum':
        try:
            r = requests.get(base_url + eth_url, timeout=3)
            r.raise_for_status()
        except Exception as err:
            print("Exception Error:", err)
            return 0.0
    elif id == 'basic-attention-token':
        try:
            r = requests.get(base_url + bat_url, timeout=3)
            r.raise_for_status()
        except Exception as err:
            print("Exception Error:", err)
            return 0.0
    elif id == 'loopring':
        try:
            r = requests.get(base_url + lrc_url, timeout=3)
            r.raise_for_status()
        except Exception as err:
            print("Exception Error:", err)
            return 0.0
    else:
        return 0.0

    return r.json()[id]['usd']


def main():
    eth_price = get_price('ethereum')
    bat_price = get_price('basic-attention-token')
    lrc_price = get_price('loopring')

    eth_amount = 0.0
    bat_amout = 0.0
    lrc_amount = 0.0
    days = []
    eth_data = []
    bat_data = []
    lrc_data = []
    total_data = []

    for key in tipping_data:
        eth_amount = f"{sum(tipping_data[key]['eth']) * eth_price:.3f}"
        bat_amout = f"{sum(tipping_data[key]['bat']) * bat_price:.3f}"
        lrc_amount = f"{sum(tipping_data[key]['lrc']) * lrc_price:.3f}"

        days.append('Data ' + key)
        eth_data.append(eth_amount)
        bat_data.append(bat_amout)
        lrc_data.append(lrc_amount)
        tip_total = float(eth_amount) + float(bat_amout) + float(lrc_amount)
        total_data.append(tip_total)

    avg_total = f"${statistics.mean(total_data):.3f}"
    print(avg_total)

    eth_data = list(map(float, eth_data))
    avg_eth = f"${statistics.mean(eth_data):.3f}"
    print('AVG_ETH: ' + avg_eth)

    bat_data = list(map(float, bat_data))
    avg_bat = f"${statistics.mean(bat_data):.3f}"
    print('AVG_BAT: ' + avg_bat)

    lrc_data = list(map(float, lrc_data))
    avg_lrc = f"${statistics.mean(lrc_data):.3f}"
    print('AVG_LRC: ' + avg_lrc)

    # Daily tipping bar chart
    fig = go.Figure(data=[
        go.Bar(name='BAT', x=days, y=bat_data),
        go.Bar(name='ETH', x=days, y=eth_data),
        go.Bar(name='LRC', x=days, y=lrc_data)],
        layout_title_text=f"""
        Publish0x Tip 20% Author 80% Me Earning Avg: {avg_total}
        """
    )
    fig.update_traces(texttemplate='%{y:.3f}', textposition='outside')

    fig.add_trace(
        go.Scatter(
            name='Tip Total',
            x=days,
            y=total_data
        )
    )

    # Change the bar mode
    fig.update_layout(
        # barmode='stack',
        xaxis_title="Tip Data",
        yaxis_title="$ Amount",
        legend_title="Crypto Tips",
    )
    fig.write_html('chart-20-80.html', auto_open=True)
    fig.show()


if __name__ == '__main__':
    main()
Get Rewarded For Browsing! Are you Brave?


➡️ Website
Looks dope (as young people say these days) 😂😂😂
LOL 🤣🤣🤣
Interesting to see this information. Thanks for sharing it.
Awww

Thank you!!!