A common thing I found from other crypto traders is that they use the dates of the full moon to find patterns.
The moon is a powerful emotional manipulator as it controls the waters of our life and our frequencies in this particular relationship.
And this to the crypto means volatility in the market. If I am wrong please let me know. Either way this is just for entertainment purposes only. Maybe somebody could make use of this.
Anyways, I was curious to see how the daily chart of BLURT/BTC appeared as this event happened.
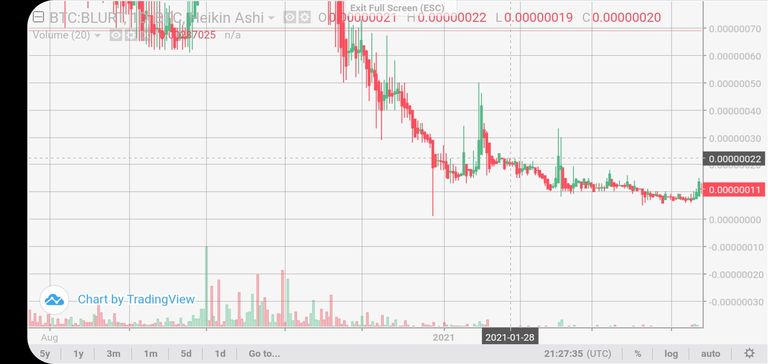
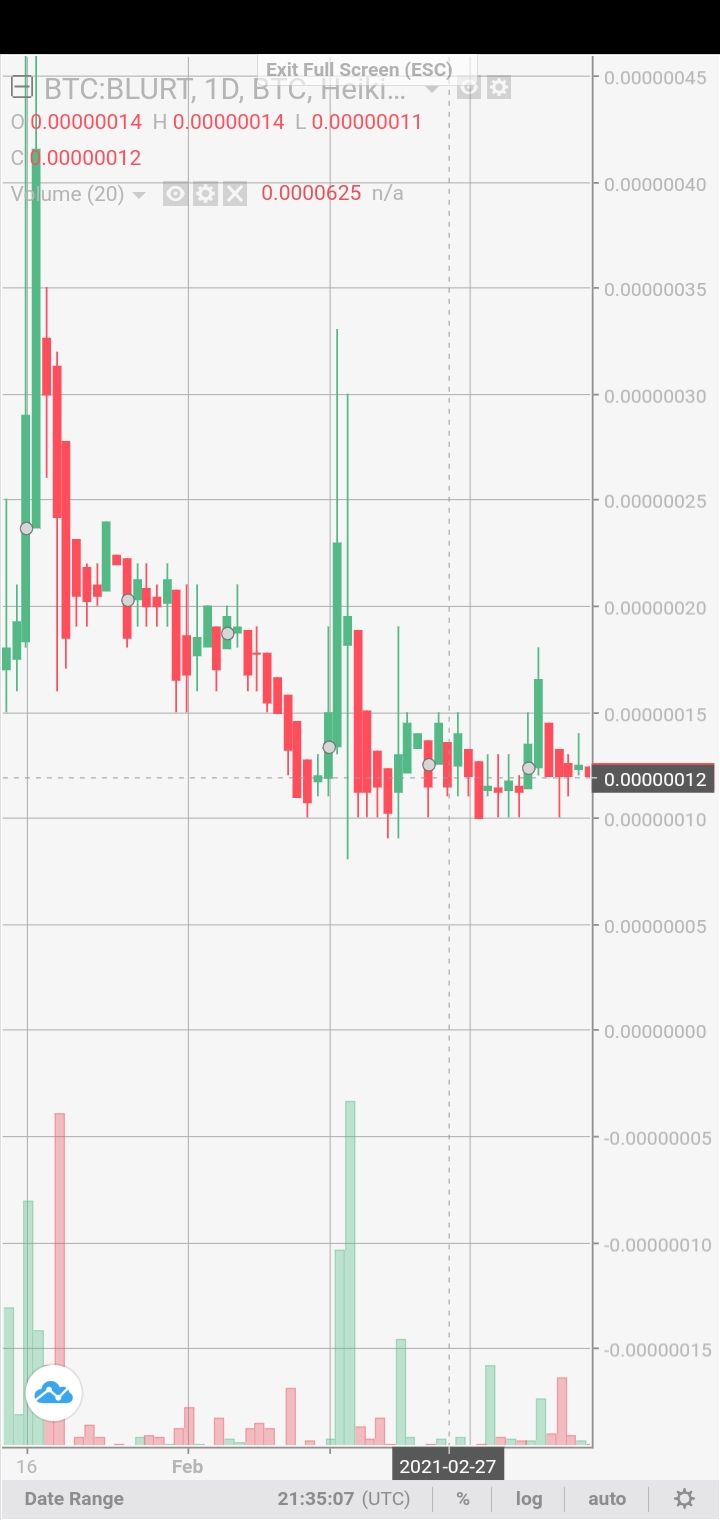
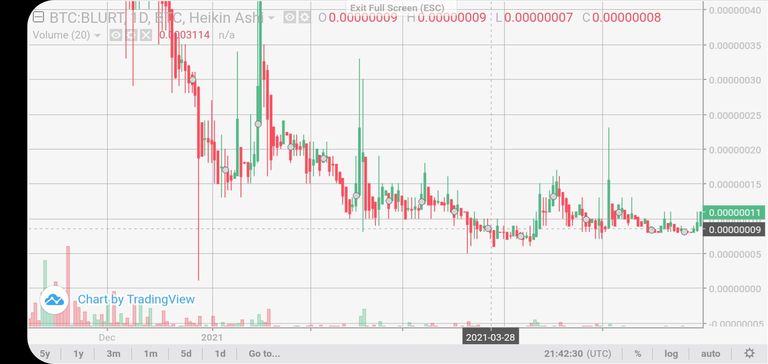
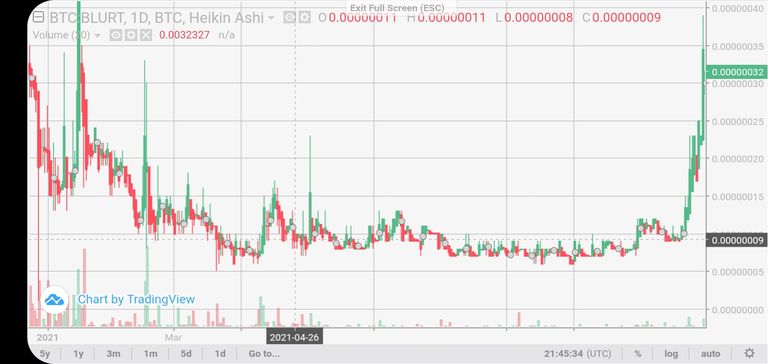
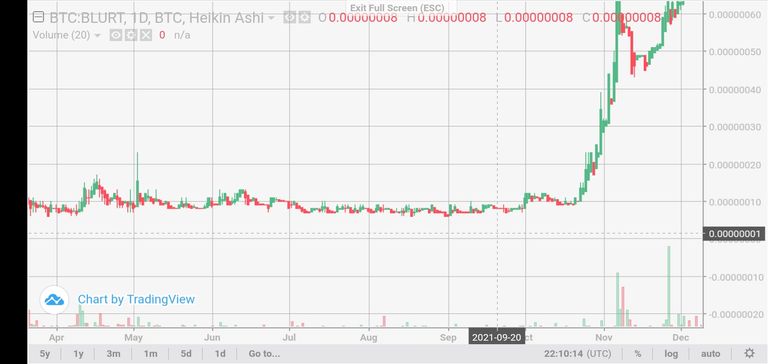
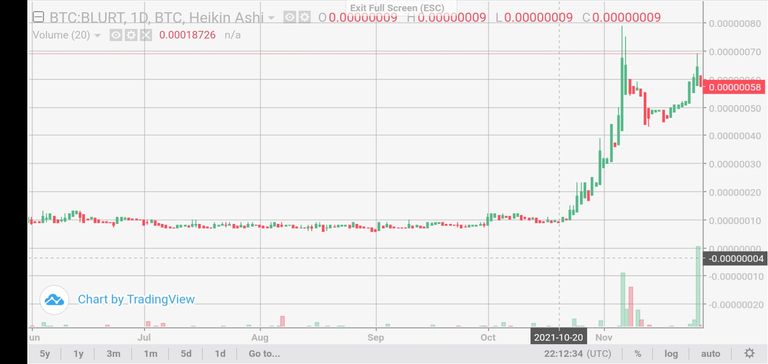
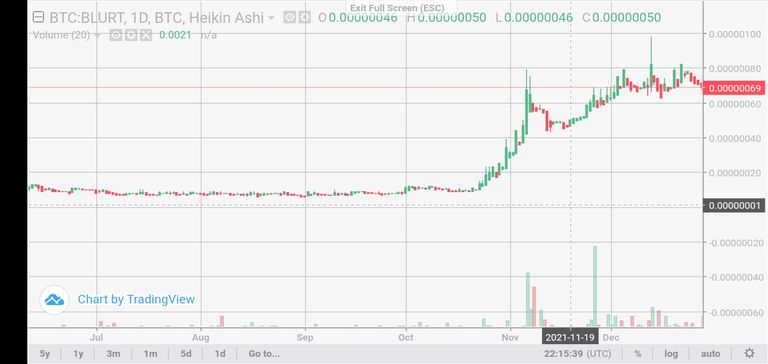
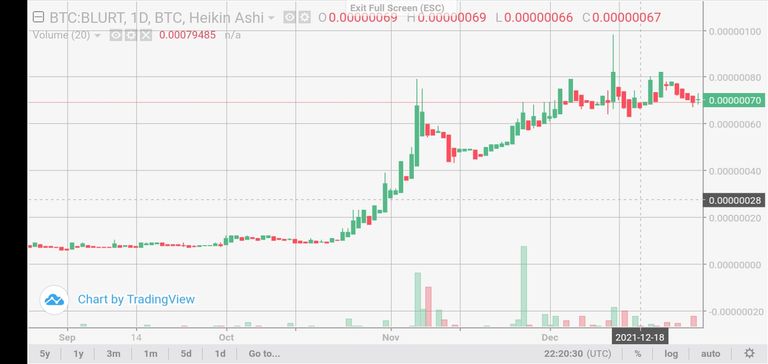
So Here is a screen shot of each day there was a full moon this last year (2021).
I am using IONOMY for the charts. It is also my go to exchange and entry to BTC and beyond and all thanks to this wonderful blogging platform. Get your free account. No KYC required.
Daily Chart BLURT/BTC Year 2021
Full Moon reference
12 screenshots
Prices of the selected candle is marked on the chart in red above for each session.
H = high price
O = opening price
C = closing price
L = Low price
I. January 28
II. February 27
III. March 28
IV. April 26
V. May 26
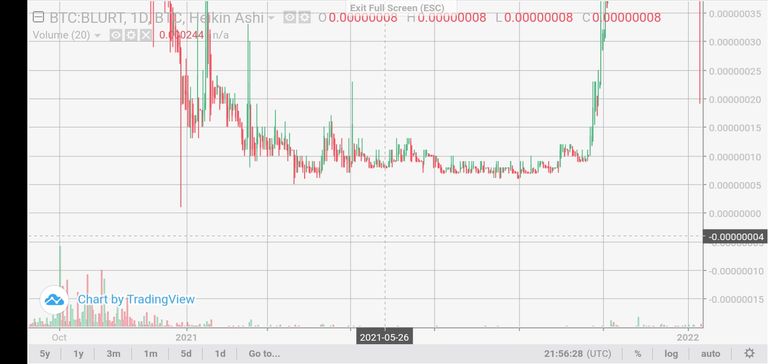
VI. June 24
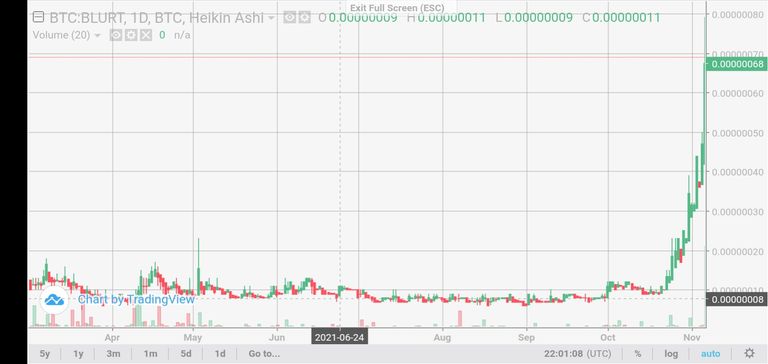
VII. July 23
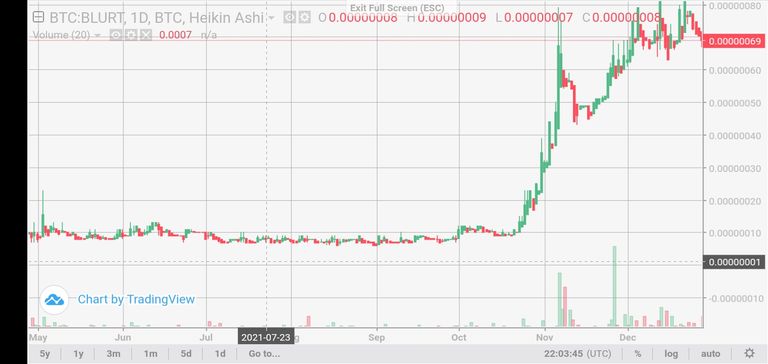
VIII. August 22
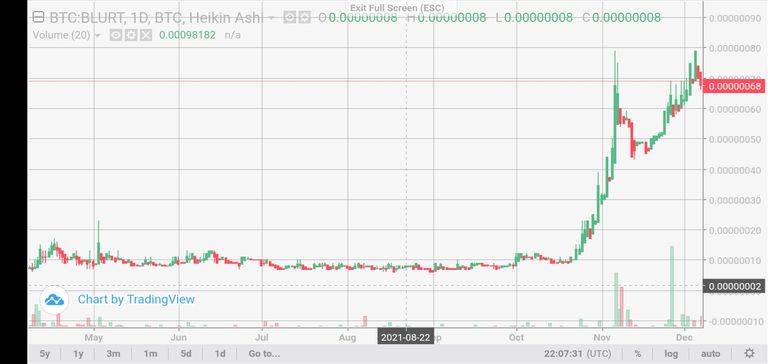
IX. September 20
X. October 20
XI. November 19
XII. December 18
Only green candles on June, August and November .
Before it shot up in price since the beginning of 2021 we was crossing the geographic state of Kansas, famous for its flatter than pancake lands.
Stay tuned for 2022.
Cheers
///
