Hi everyone out there, in this post you gonna be shown a powerful tool and strategy that you can used to find out the direction of trends in financial charts and execute your trades accordingly.
"The Rainbow strategy uses a profit target order and a stop loss order: The initial stop loss is placed on the low of the last 5 candles. The stop starts to trail the market price if the slowest EMA goes above this initial stop level. The profit target is a multiple of the initial risk."Source
The strategy is very powerful and has a higher winner rates of almost complete percentage 💯💯💯 of 100 with very little losses if at all it went other way round.
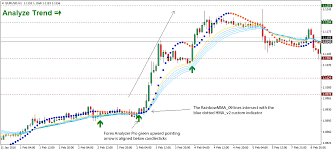
The strategy is based on 5 moving averages in which the screenshot diagrams would be shared on this post for those interested in it to apply it for their mt4 or whatever and see the powerful of the strategy as it combines both price action trading and indicator.
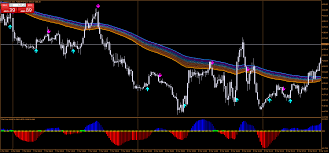
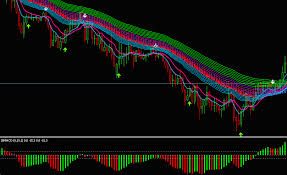
First of all, let's start the strategy with screenshots taken which is very self explanatory indeed.
The following are the steps to follow I'm order to use the strategy:
1- Determining whether the market is uptrend or downtrend by using the 100 Moving Average
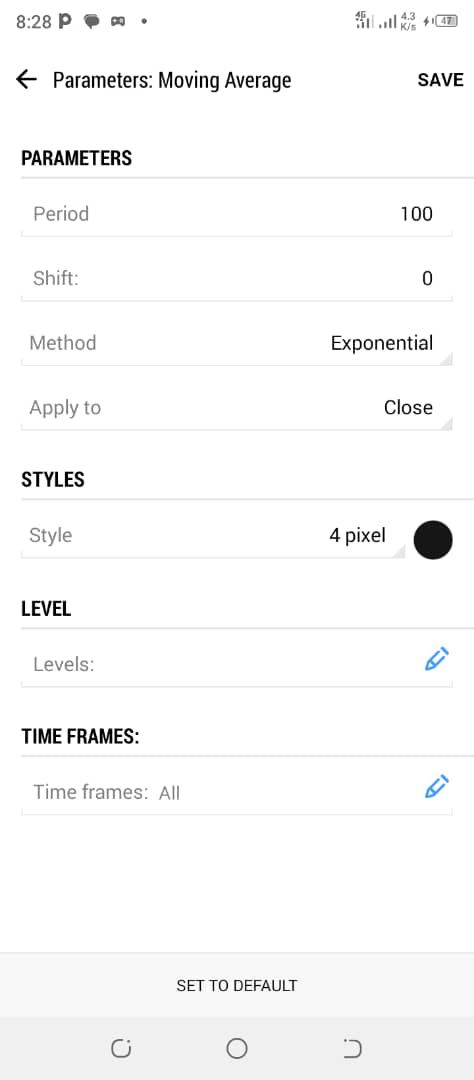
This is the Moving Averages setting for trend structure, if you are using white background it would be black for easy visibility and if you are using black background ground for your chats you will be using white moving average line.
2- Second Moving Average is the Trendline Confirmation moving average
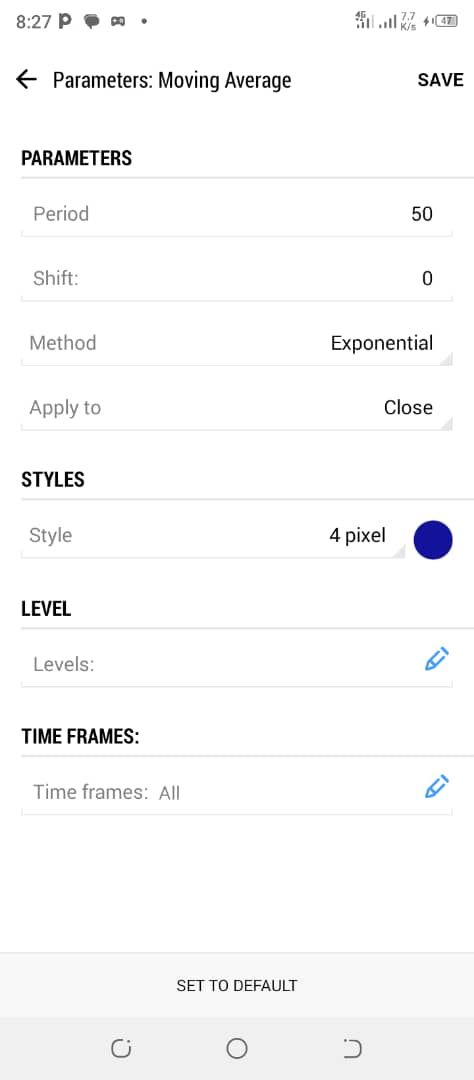
This is exponential moving average 50 used for confirmation of Trendline moving average. It shown when it is above the Trendline moving average then it confirms that the Trendline is uptrend and the market is bullish but in downtrend market, it has to be above the downtrend EMA 100 as well for confirmation. It works in the same approach for uptrend and downtrend markets.
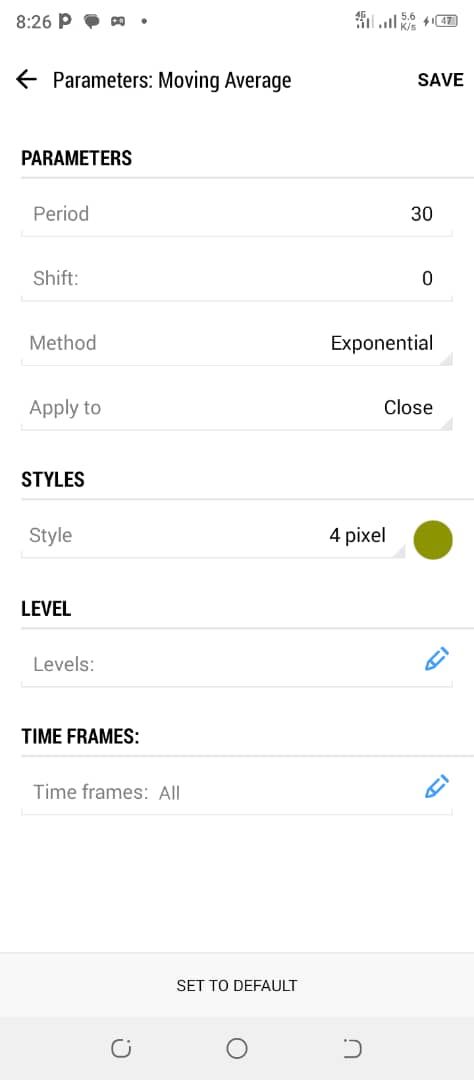
3- The third moving average is the retracement moving average which is used to confirm retracement.
This moving average is important in that before you enter a trade there must be a retracement or pullback first which must touches the moving average 30 before the trend continues in the normal direction.
The setting for moving average 30 which is retracement moving average is below;
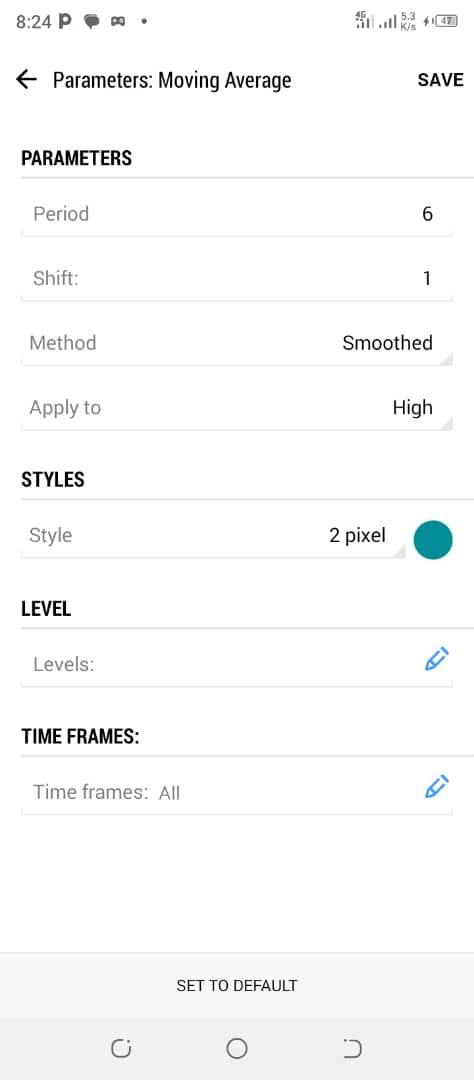
4- Last but not least, is the moving average for both uptrend and downtrend markets using the following moving average settings accordingly.
Both of these moving averages should broke out and the market must be waited to know whether it is bullish or bearish market and then you either sell or buy depending on the market trends.
A confirmation could be done for more clarity and confidence on smaller timeframes before decision is made such using 1 minutes timeframe for confirmation.
For instance, a one minute could be used to confirm what is observed on 30 minutes, 15 minutes timeframe could be used to confirm what is going on on 1 hour timeframe and so on. This is done for proper clarity and good decision making in the market.
The moving average settings for both uptrend and downtrend markets is below.
A- For Selling market, this is the settings.
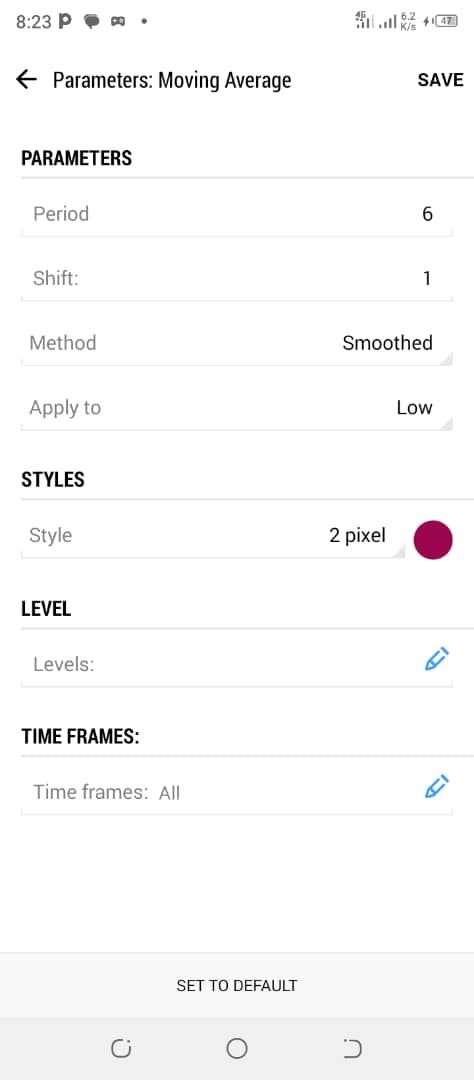
B- For Buying market, this is the settings.
In a nutshell, after the prices closes above or below the moving average for either a buy or sell moving average then a buy or sell trade is executed. This strategy is a Trendline based strategy that works out in most cases.
It can be backtested or front tested for its reliability and performance in its accuracy. That's all as regards this strategy at least for now more would discussed if there is any modifications on it and happy blogging.
Happy Blogging and Reading 💥💥💥💥💥
Video from Stock accurate YouTuber
